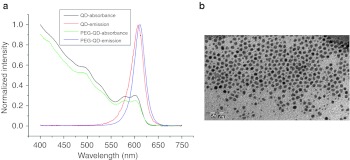
Figure 2.
Characterization of QD and QD-PEG. (a) The optical absorption and emission spectra of QD and QD-PEG show that QD-PEG had a distinct red shift in an emission wavelength of 610 nm, compared with oil-soluble QD (605 nm). (b) The TEM image shows that QDs were monodisperse and 5 ± 2 nm in diameter (Bar = 50 nm). No aggregation was observed. QD-PEG, quantum dots-polyethylene glycol; TEM, transmission electron microscopy.

