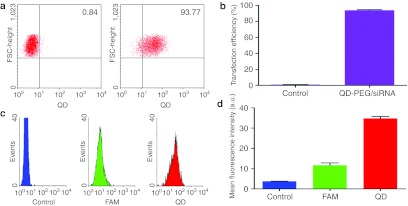
Figure 4.
Quantification of the transfection efficiency of QD-PEG/siRNAs by FACS. After a 1 hour transfection, 10,000 events for each sample were estimated by flow cytometric analysis. (a) The non-transfected cells (left: control group) and transfected cells (right: transfection group of QD-PEG/siRNAs) were collected from dot plots defining a region around the main fluorescing population of QDs. A significant increase in transfected cells (93.77 ± 1.18%) indicated the novel improvement of transfection efficiency, compared with the control group (0.84 ± 0.19%). (b) The transfected and non-transfected cells were plotted on a histogram. (c,d) The histograms of the fluorescence intensity for QD-labeled cells (red line), siRNA-labeled cells (green line), and unlabeled cells (blue line) were generated; the histograms show that the fluorescence intensity of QD was threefold greater than that of siRNA at the same concentrations. a.u., arbitrary unit; FACS, fluorescence-activated cell sorting; FSC, forward scatter; PEG, polyethylene glycol; QD, quantum dots; siRNA, small interfering RNA.

