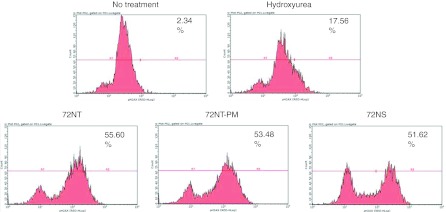
Figure 3.
Fluorescence-activated cell sorting (FACS) analysis of the phosphorylation of H2AX. HCT116-19 cells synchronized with 2 µmol/l aphidicolin 24 hours before the addition of 2 mmol/l hydroxyurea (HU) or 4 µmol/l 72NT-PM, 72NT, or the 72NS DNA oligonucleotides (ODN). The reaction was allowed to proceed for 24 hours after which time the cells were processed for staining with antibodies directed against pH2AX. Analyses took place on a Guava EasyCyte 5HT Flow Cytometer (see Materials and Methods section) and phosphorylation is assessed by the egree of shift of the cell population to the right. The number in the upper right hand corner indicates the percentage of cells scoring positive for H2AX activation.

