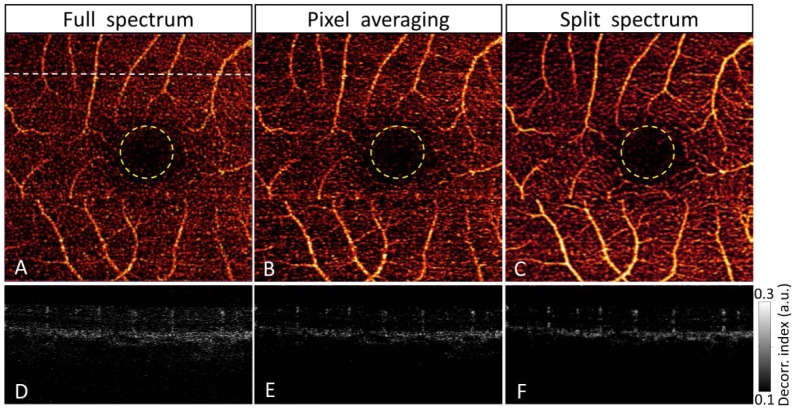
Fig. 6.
Comparison of amplitude-decorrelation angiography using three different algorithms: full-spectrum (A, D), pixel-averaging (B. E) and split-spectrum (C, F). The macula was scanned in a 3x3 mm area. En face maximum decorrelation projections of retinal layers (A-C) showed the macular vascular network around the central foveal avascular zone (yellow circles) of 600-µm diameter. The cross-sectional angiograms (D-F) scanned across a horizontal line in the superior perifoveal region (upper dashed line of A). White bar, 500 µm.

