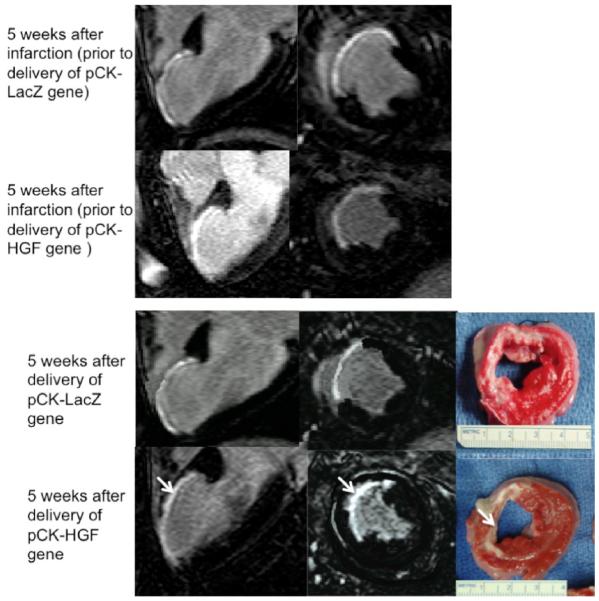
Figure 2.
Long and short axis views of DE-MR images illustrate the hyperenhanced infarct at 5 weeks after infarction of two representative animals (top block). The bottom block shows the effects of pCK-LacZ (top row) and pCK-HGF genes (bottom row) on infarct transmurality (arrow) and size 5 weeks after treatment. Histochemical TTC staining (right LV slices) confirms the smaller and non-transmural infarct (arrow) in the pCK-HGF treated animal compared with pCK-LacZ control animal.

