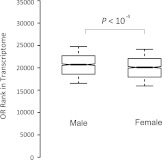
FIG. 1.—
Comparison of ranked expression levels of Olfr genes in the OE transcriptomes of male and female mice. The values of upper quartile, median, and lower quartile are indicated in each box, and the bars outside the box indicate semiquartile ranges. Male Olfr genes tend to express at a higher level (Mann–Whitney U test, P < 10−4).

