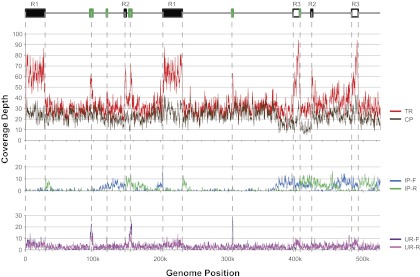
FIG. 1.—
Depth of read coverage across the genome. All reads in the Lib35k sublibrary were mapped to the mitochondrial consensus sequence and read depth was calculated in several ways. Top panel: read depth of TRs (red line) that mapped to the mitochondrial consensus sequence and CPs (brown line) that mapped in the proper orientation and distance. Middle panel: read depth of inconsistent read pairs mapping in a forward (IP-F, green line) or reverse (IP-R, cyan line) orientation. Lower panel: read depth of reads whose mate pair did not map to the mitochondrial genome; these unpaired reads were also split into forward (UR-F, purple line) and reverse (UR-R, pink line) mapping orientations. Above the coverage plots, a linear representation of the genome is given that shows the position of all direct repeats (white boxes), inverted repeats (black boxes), and inserted chloroplast DNA (green boxes) >1 kb in length.

