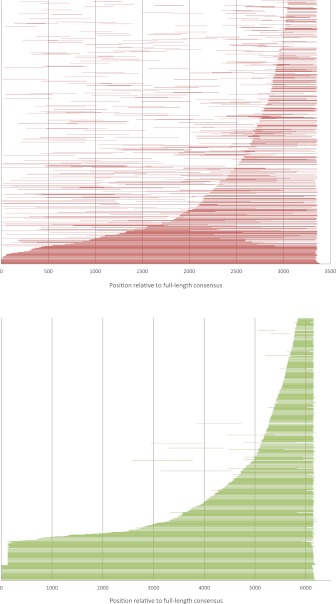
FIG. 9.—
Length distribution of stickleback Expander elements (top) and human L1 elements (bottom). Elements are ordered by length from the shortest one at the top of the graphs to the longest one above the x axis. Note that the scale is different as a full-length Expander element is ∼3.3 kb, whereas a human full-length L1 is ∼6 kb.

