
Figure 6.
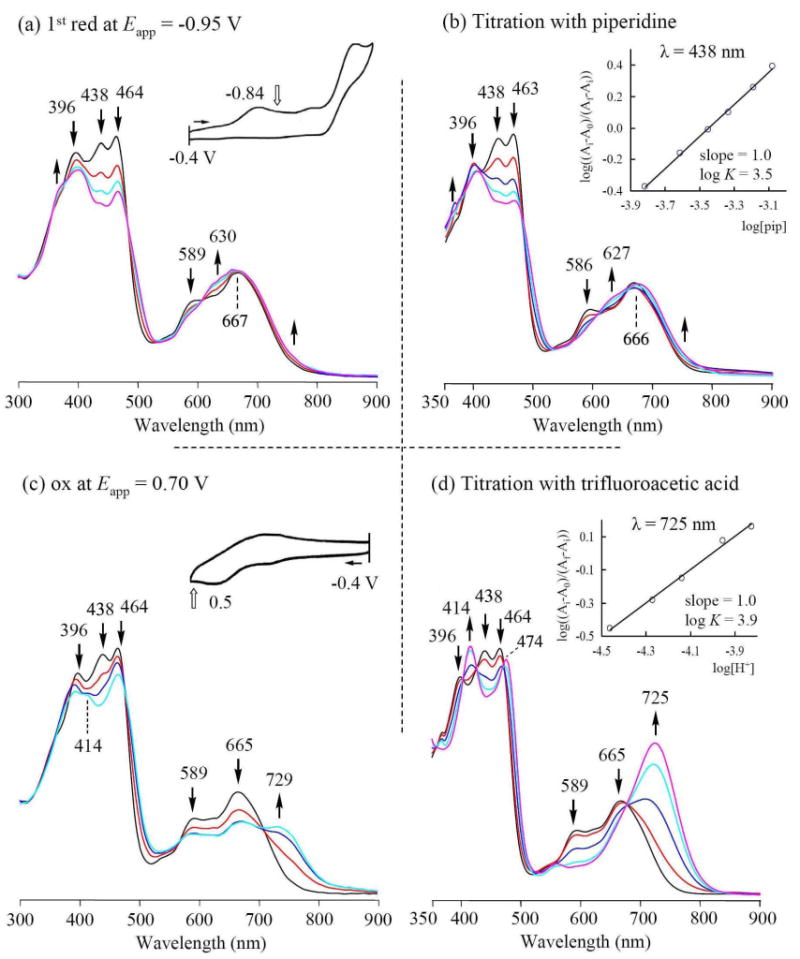
UV-visible spectral changes of 3-NO2TTCorrH3 in CH2Cl2 during (a) the controlled reduction at -0.95 V, (b) successive addition of piperidine (inset shows the Hill plot), (c) the controlled oxidation at 0.70 V and (d) successive addition of TFA (inset shows the Hill plot).