
Figure 6.
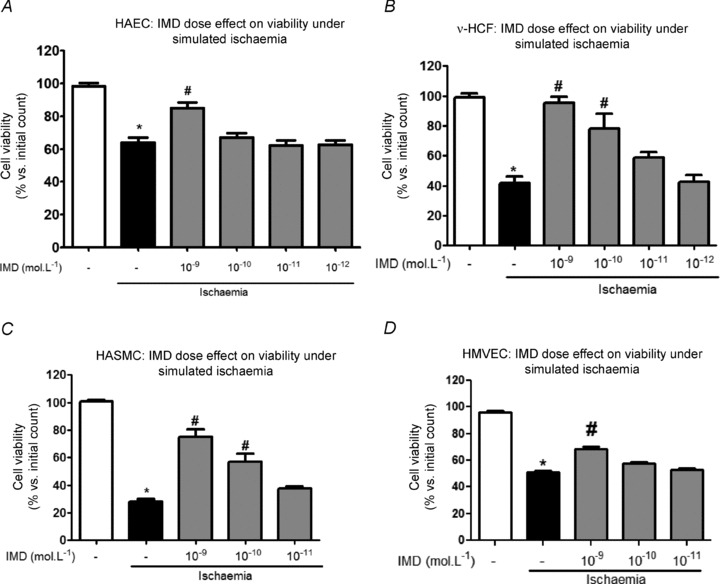
Dose-dependent effect of IMD (at concentrations ≤10−9 mol l−1; grey columns) on cell viability under simulated ischaemia (4 h) for those cell types investigated in Fig. 1. n = 3 cell sources (or individual cultures for v-HCFs) run in duplicate. *P < 0.05 vs. normoxia alone (open column) and #P < 0.05 vs. Ischaemia without IMD (black filled column).