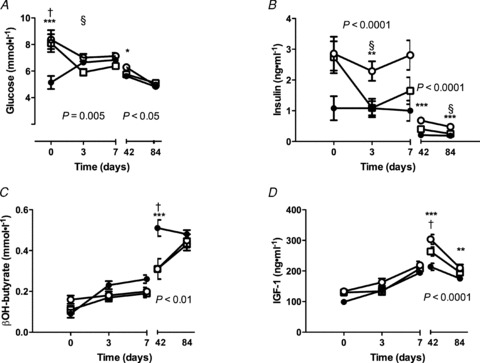
Figure 4. Lamb metabolite and hormone plasma concentrations from birth to weaning.

A, glucose; B, insulin; C, β hydroxybutyrate (βOH-butyrate); D, IGF-1. Data are mean ± SEM. Open squares, Singletons; filled circles, Twins; open circles, Reductions. The P value is for the repeated-measures ANOVA from days 0–7 or days 42 and 84. Tukey post hoc: *P < 0.05, **P < 0.01, ***P < 0.001 for Reductions vs. Twins; †P < 0.001 for Singletons vs. Twins; §P < 0.05 for Reductions vs. Singletons.
