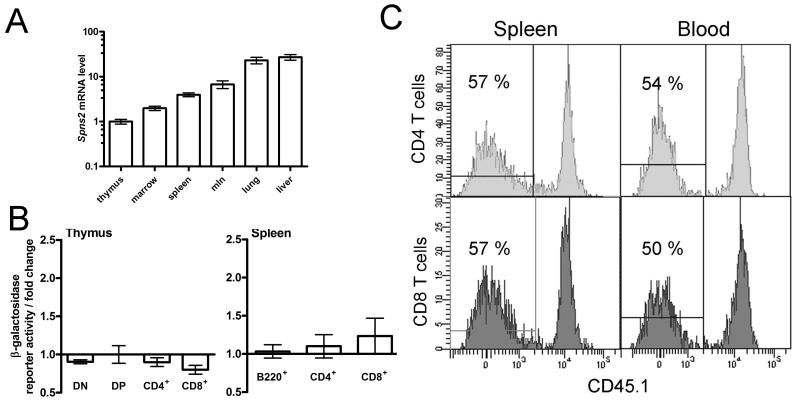
Figure 5. Analysis of Spns2 expression.
(A) qRT-PCR analysis of the Spns2 transcript levels in the tissues of wild type mice. Analysis using primers spanning exon junctions 5-7 of Spns2 coding transcript ENSMUST00000045303, data analyzed using the ΔΔC method with β-actin as the housekeeping control; Spns2 transcript levels in the thymus were assigned the arbitrary value of one and the levels in other tissues expressed relative to it. (B) β-galactosidase reporter activity in thymocytes, and splenic B and T cells, as a measure Spns2 gene expression. The measurements were done in Spns2+/tm1a cells and are presented as fold change relative to the background β-galactosidase activity in the same cell type in wild type mice. The cells were gated as: CD4−CD8− for double negative thymocytes (DN), CD4+CD8+ for double positive thymocytes (DP), and B220+ for splenic B cells. Bars represent means ± SEM from ≥3 mice per group. (C) Mixed bone marrow chimeras, demonstrating that the defects in the development and localization of Spns2tm1a/tm1a T cells are not due to a cell-intrinsic requirement for Spns2. Lethally-irradiated Spns2+/+Rag1−/− recipients were reconstituted with a 50:50 mix of wild type CD45.1+-marked and Spns2tm1a/tm1a bone marrow. Flow cytometry histograms of CD4 and CD8 T cells in the spleen and blood at 8 weeks following reconstitution are shown, percentage of C45.1- Spns2tm1a/tm1a T cells in each plot is indicated.

