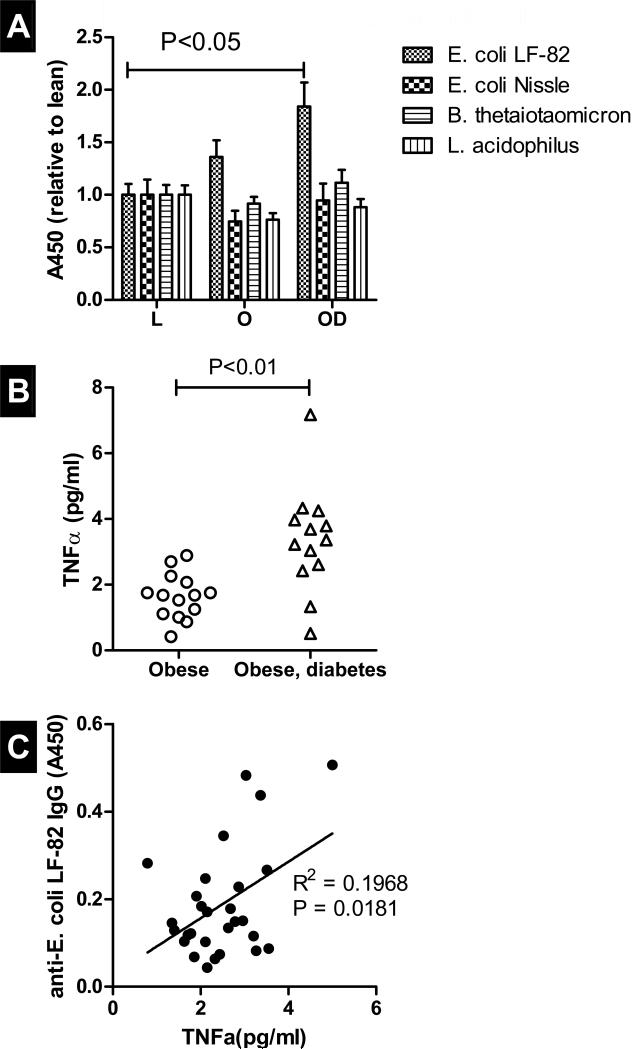
Figure 1.
IgG against extracts of E. coli (strains LF-82 and Nissle), B. thetaiotaomicron, and L. acidophilus in plasma from lean and obese controls and obese patients with diabetes (A). Shown are A450 (average ± S.E.M) obtained with plasma from lean controls (“L”; n=10), obese controls (“O”; n=16) and obese patients with diabetes (“OD”; n=16). Values are normalized for those of lean controls. Panel B shows TNFα in the blood of obese controls and obese diabetic patients; panel C shows a positive correlation between IgG against extracts of E. coli LF-82 and TNFα. Asterisks indicate statistically significant differences between groups (T-test, P<0.05)

