
Figure 7.
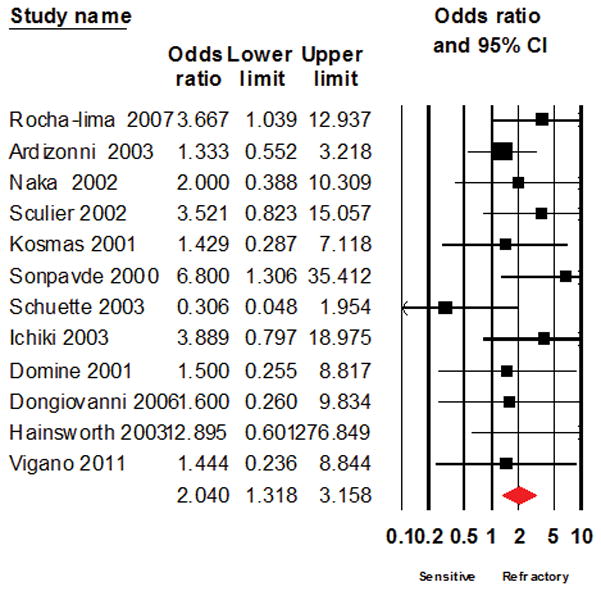
Forest plot of the result of systematic analysis for Odds ratio of response to salvage chemotherapy after excluding studies that evaluated single agent treatment regimens
Official websites use .gov
A
.gov website belongs to an official
government organization in the United States.
Secure .gov websites use HTTPS
A lock (
) or https:// means you've safely
connected to the .gov website. Share sensitive
information only on official, secure websites.
Forest plot of the result of systematic analysis for Odds ratio of response to salvage chemotherapy after excluding studies that evaluated single agent treatment regimens