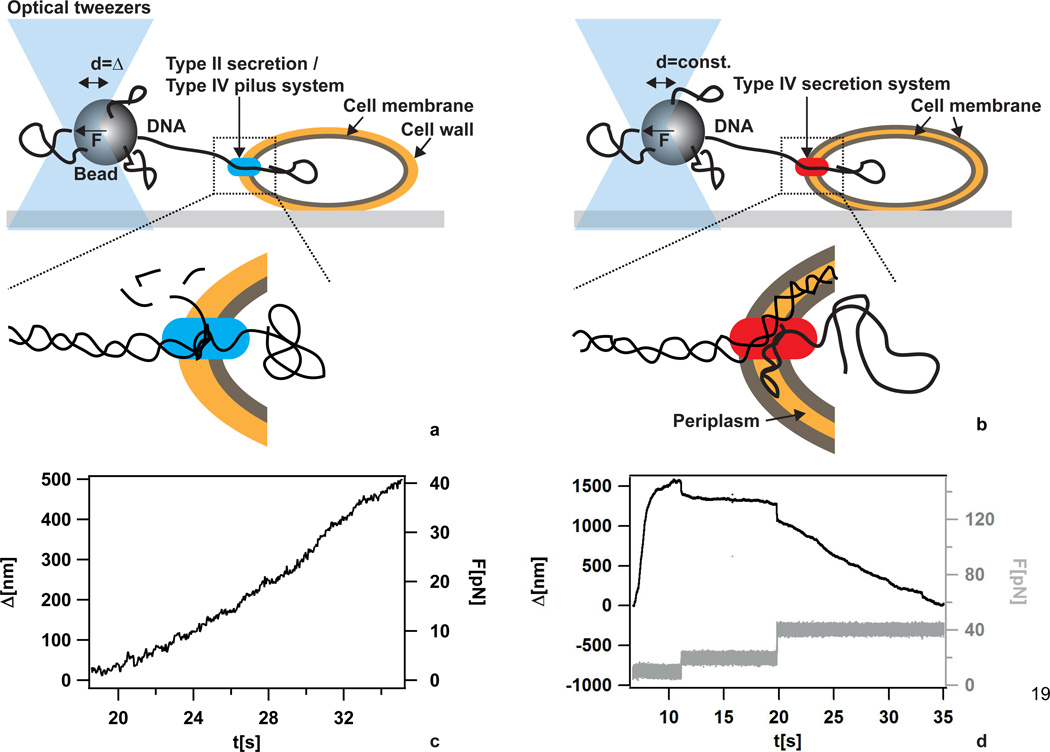
Figure 3.
DNA import during transformation. a) Scheme of the setup for measuring DNA import kinetics through the single membrane of B. subtilis. No force clamp was applied. b) Scheme of the setup for measuring DNA import kinetics through the two membranes of H. pylori. A force clamp was applied. c) Typical DNA import event in B. subtilis. Δ denotes the length of imported DNA after monitoring was started. With increasing Δ, the deflection of the bead from the center of the laser trap increased leading to increasing force F. d) Typical DNA import event in H. pylori. Δ denotes the length of imported DNA after monitoring was started. The force F was clamped at different values.

