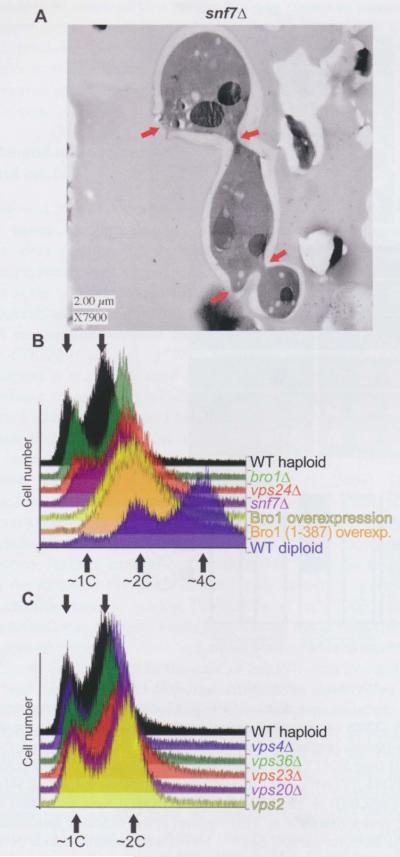
Figure 1.
Cytokinesis failure and aberrant DNA content in cells with ESCRT-III defects.
(A) High-pressure frozen and freeze-substituted cells of strain MWY24 were embedded in plastic, thin-sectioned and visualized by TEM. The red arrows indicate sites of impending or aborted cytokinesis. (B) Approximately 10 000 PI-stained cells of each indicate genotype were analyzed by flow cytometry to measure DNA content. Histograms of the resulting distributions were manually offset rightward on the x-axis to facilitate comparison of the profiles. The arrows indicate the approximate peak values corresponding to IC, 2C, or 4C DNA content. The strains were: SEY6210 (WT haploid), GOY65 (brolΔ), BWY102 (vps24Δ), MWY24 (snf7Δ), SEY6210 carrying plasmid pG0216 (Brol overexpression), SEY6210 carrying plasmid pMWM3 [Brol (1–387) overexpression], and SEY6210 diploid (WT diploid). (C) As in (B), for strains SEY6210 (WT haploid), MBY3 (vps46Δ), MBY30 (vps36Δ), EEY6-2 (vps23Δ), EEY2-1 (vps20Δ), and MBY28 (vps2Δ).

