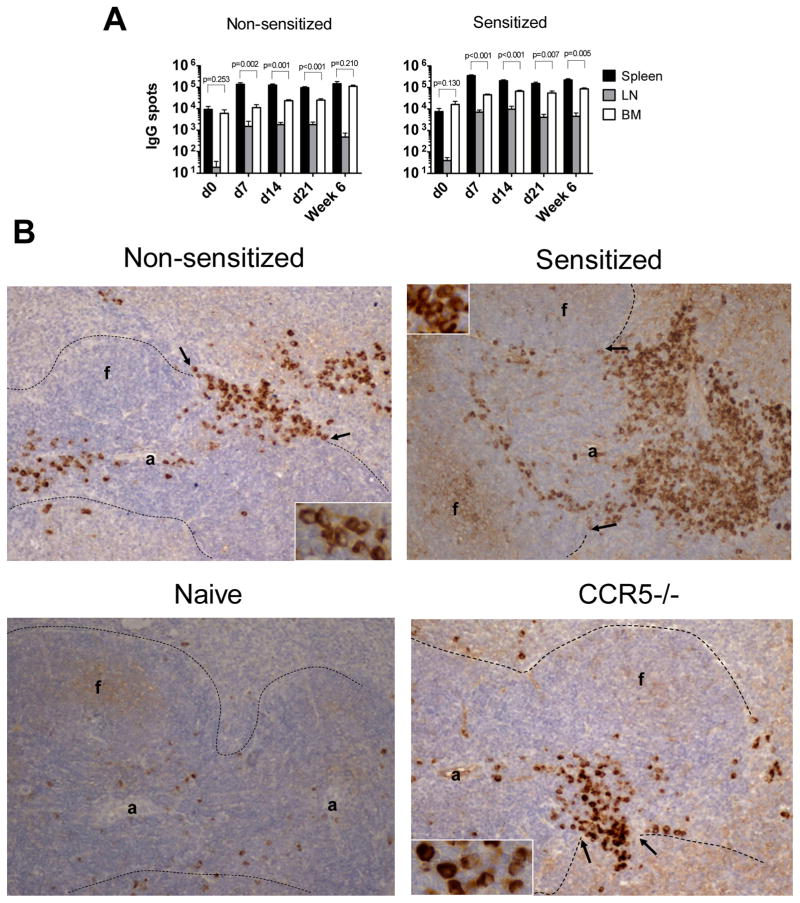
Figure 4. Distribution of IgG producing ASCs within spleen, mediastinal lymph nodes and bone marrow of sensitized and non-sensitized recipients.
A. Spleen, BM and mediastinal lymph nodes cells were isolated at indicated time points after transplantation or from naïve B6 mice as a control. The total numbers of IgG-secreting cells per each compartment were determined by ELISPOT assay. N = 4–5 mice per group at each time point. B. Immunohistochemical staining of recipient spleen sections for IgG secreting cells at day 7 post transplant. Spleen tissues were excised, fixed and embedded in paraffin. 5μm sections were prepared and stained with anti-mouse IgG antibodies. Dotted lines indicate the border between white and red pulp. Arrows point to bridging channels with clusters of IgG+ ASCs; “a” = arteriole, “f” = follicle. Original magnification 20x, insets 60x.

