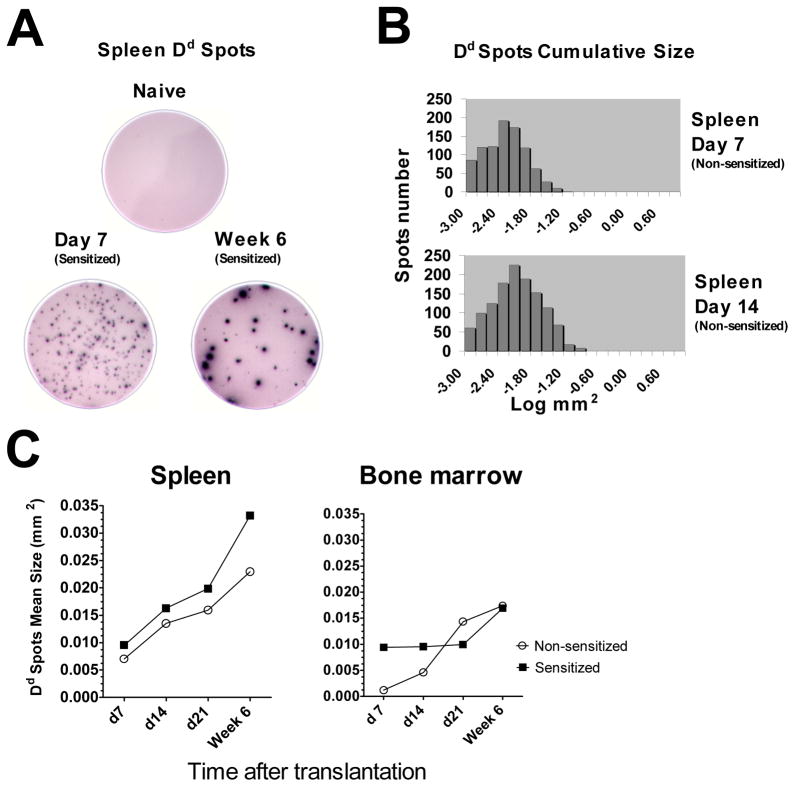
Figure 6. Secretion of donor MHC binding IgG by individual ASCs.
A–B. ELISPOT well images and cumulative spot size histograms illustrate increasing production of allo-reactive antibody by individual cells. C. The kinetics of average Dd-binding spot size in sensitized versus non-sensitized recipients. All ELISPOT assays were performed in duplicates, average spot sizes were determined for 4–5 recipients per group at each time point.

