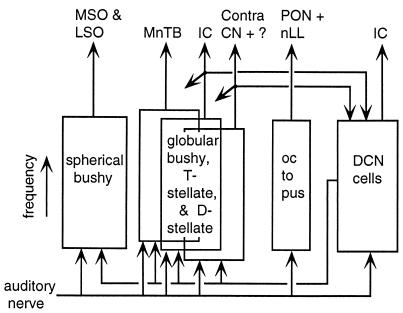
Figure 1.
Schematic of the mammalian cochlear nucleus, the equivalent of the ELL in the auditory system. Each box represents one principal cell type; the vertical extent of each box represents the cochlear frequency axis, which is fully mapped onto each cell type. The boxes for the globular bushy, T-stellate, and D-stellate cells are shown overlapped because these cell types occupy the same map in one region of the nucleus. Horizontal arrows show major interneuronal interconnections and collateral projections. The arrows at the top identify the projection sites of each cell type. MSO and LSO, medial and lateral superior olivary nuclei; MnTB, medial nucleus of the trapezoid body; IC, inferior colliculus; CN, cochlear nucleus; PON, periolivary nuclei; nLL, nuclei of the lateral lemniscus.

