Fig. 2.
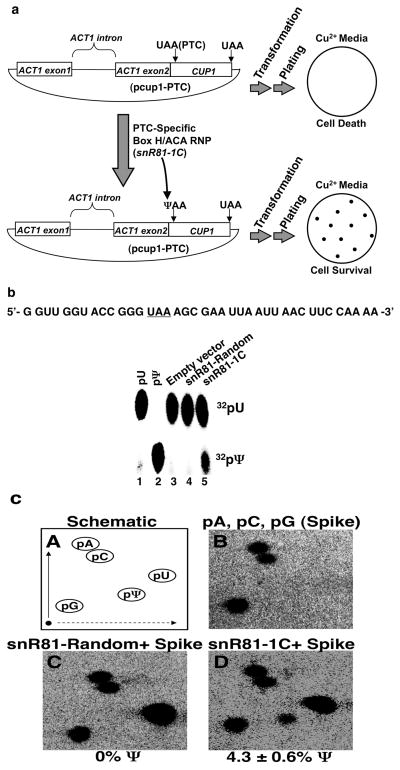
Quantification of cup1-PTC pseudouridylation. (a) Schematic of the in vivo nonsense suppression assay. (b) In vitro pseudouridylation assay by thin layer chromatography. 5′ 32P-radiolabeled uridylate (pU) and pseudouridylate (pΨ) markers were run in parallel. The substrate—[α32P]UTP uniformly labeled RNA fragment—is shown. (c) Quantification of cup1-PTC pseudouridylation in vivo. The percentage of pseudouridylation was calculated [pΨ/(pΨ + pU)]. Adenosine 5′-monophosphate (pA), cytidine 5′-monophosphate (pC), guanosine 5′-monophosphate (pG), uridine 5′-monophosphate (pU), and pseudouridine 5′-monophosphate (pΨ) are indicated. (●) Origin. Error is given as the standard deviation of three independent experiments.

