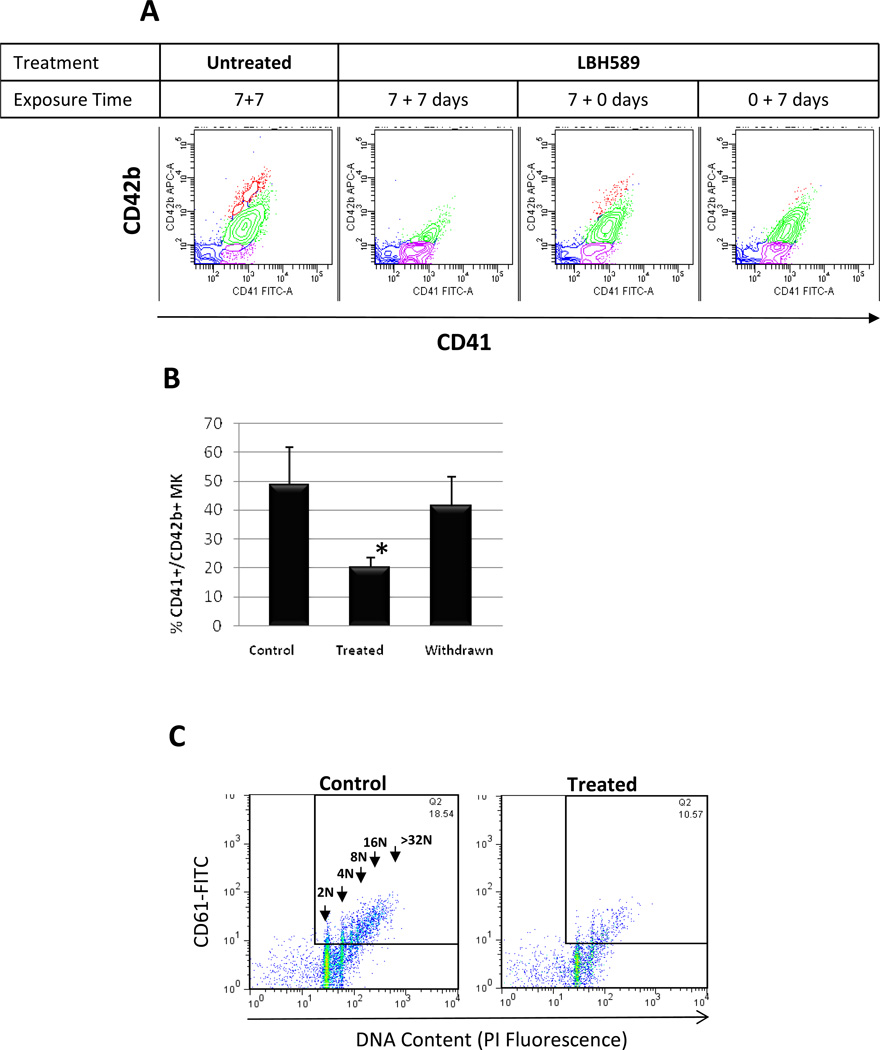
Figure 2. Evaluation of MK maturation in liquid cultures.
A. Representative flow cytometric analysis of MK cultures labeled with FITC-conjugated anti-CD41 and APCconjugated anti-CD42b antibodies. The density plot on the left represents analysis of control MK showing three different populations of MK: immature (i.e. assigned in purple), undergoing cytoplasmic maturation (i.e. assigned in green) and fully mature (i.e. assigned in red). The next three density plots represent analyses of MK treated with 2.5 nM LBH589 as it follows: continuously during the two-steps of the 14-day period (7±7 days), only during the first step (7±0 days) and only during the second step. B. An analytical gate was set to include only viable cells (i.e. negative for 7-AAD staining) then CD41+/CD42+ MK were quantified in Control cultures, in cultures treated with LBH589 during the entire 14-day culture period (Treated) and in cultures treated with LBH589 only during the first step of the culture period (Withdrawn). * p value < 0.05. C. Representative flow cytometric analyses of DNA content of PI-stained CD41+ MK grown in the absence (Control) or in the presence of 2.5 nM LBH589 (Treated). The arrows indicate ploidy classes ranging from 2N to 32N.

