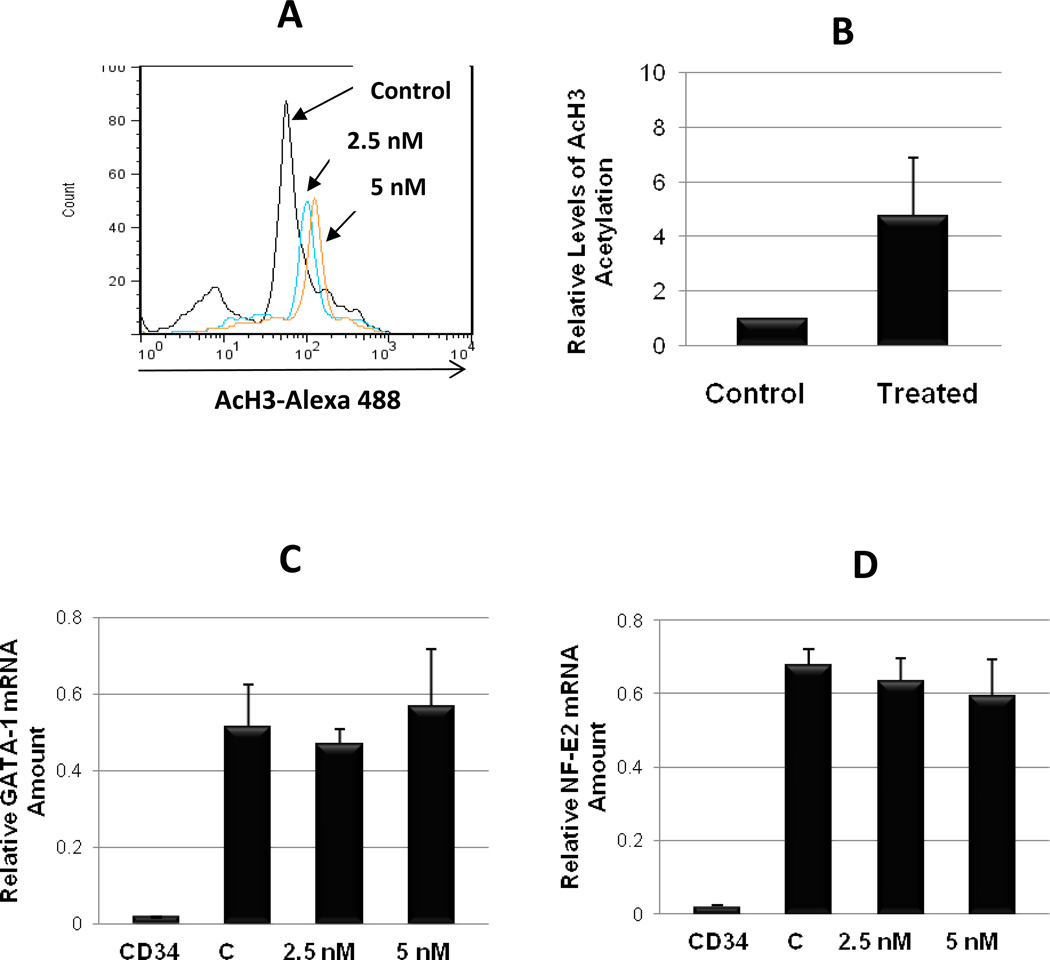
Figure 4. Evaluation of histone acetylation and MK gene expression.
A. Flow cytometric analysis of acetylated histone H3 in primary MK from control cultures and in cultures treated with LBH589 (2.5 nM and 5 nM) for 72 hrs. The shift in the mean AcH3-Alexa 488 fluorescence (x axis) indicates increased H3 acetylation. B. Quantification of relative AcH3 levels in three different experiments ±SD. * p value < 0.05. C and D. mRNAs extracted from undifferentiated CD34+ cells (CD34), from control mature MK (C) and from mature MK treated with 2.5 nM and 5 nM LBH589 during the maturation step (i.e. final 7 days in liquid culture) were reverse transcribed then amplified by quantitative real-time PCR using human GATA-1 (C) and NF-E2 (D) primers. Each column represents the average ±SD of three independent experiments each performed in duplicate and normalized to GAPDH.

