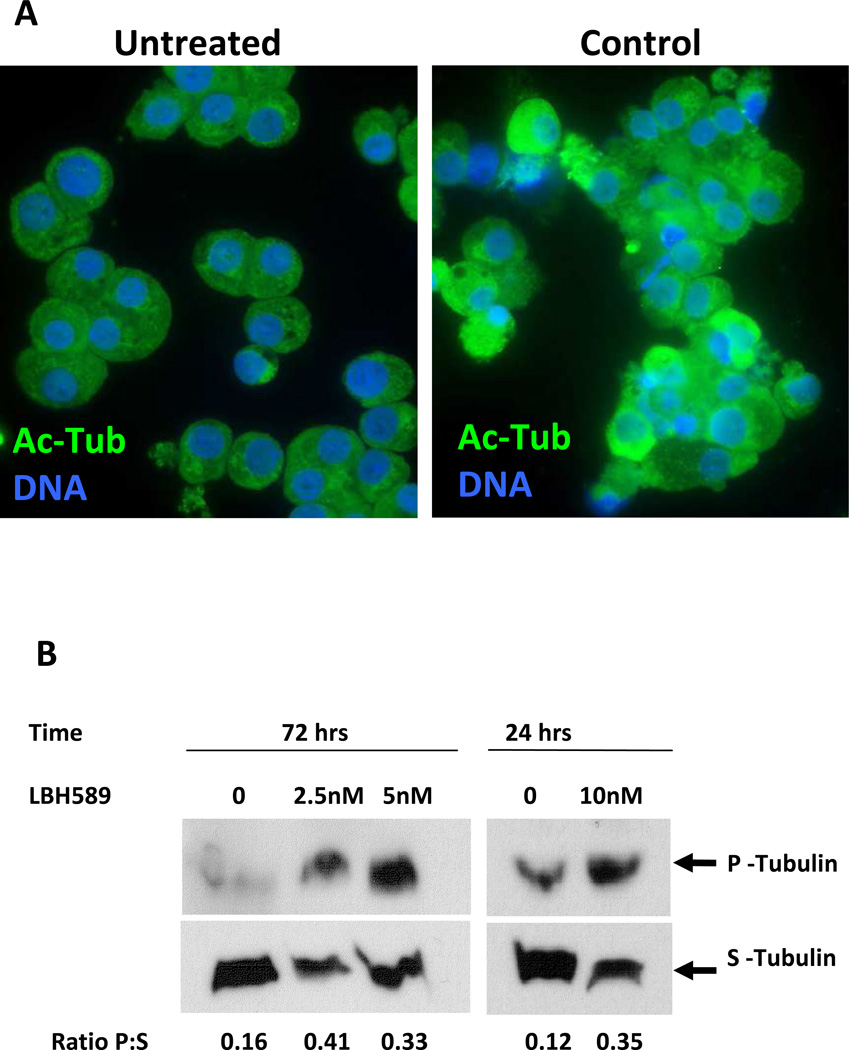
Figure 5. Evaluation of LBH589 on tubulin acetylation and polymerization.
A. Immunofluorescence microscopy analysis of control MK and of MK treated with 2.5 nM LBH589 for 72 hours. CD41+ MK from each condition were sorted by means of immunomagnetic labeling then stained with anti-acetylated tubulin antibodies to visualize acetylated tubulin (Ac-Tub, green fluorescence) and with Hoechst 33342 to visualize the nuclei (DNA, blue fluorescence). Note, the intense, uneven immunofluorescence in LBH589-treated MK as compared to the dim, uniform labeling in control MK. B. Soluble (S) and polymerized (P) tubulin were isolated from equal numbers of control MK (0) or LBH589-treated MK (2.5 nM, 5 nM and 10 nM) sorted based on CD41 expression then assessed by Western blotting as described in the Materials and Methods. The numbers represent the ratio of polymerized:soluble tubulin (Ratio P:S) calculated from the relative protein levels measured on the autoradiographs using NIH ImageJ software.

