Figure 2.
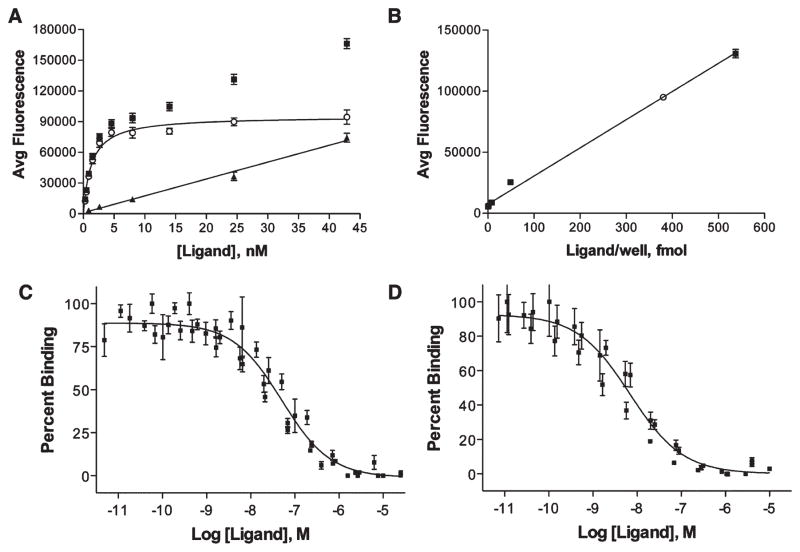
Receptor number determination and representative binding curves. (A) Saturation binding analysis of Eu-DTPA-NDP-α-MSH binding to HEK293/hMC4R/tCCK cells where (■), (○), and (▲) indicate total, specific, and nonspecific binding, respectively. From these data, Kd = 1.30 ± 0.14 nM and Bmax = 95 200 ± 2500 AFU. (B) Standard curve relating [Eu-DTPA-NDP-α-MSH] to fluorescent signal. For binding to the hMC4R, the Bmax was determined to be 95 200 ± 2500 AFU, which correlates to 380 fmol/well. (C) The ligands were evaluated for their monovalent and bivalent binding by comparing them against Eu-labeled lanthaligands. Single plot IC50 values were determined where data from all n measurements were pooled first and nonlinear regression analysis performed. Binding of ligand 12c compared with 0.1 nM Eu-DTPA-CCK8 in HEK293/CCK cells, with an IC50 of 130 nM. (D) Binding of ligand 12c compared with 0.1 nM Eu-DTPA-CCK8 in HEK293/hMC4R/CCK cells, with an IC50 of 38 nM.

