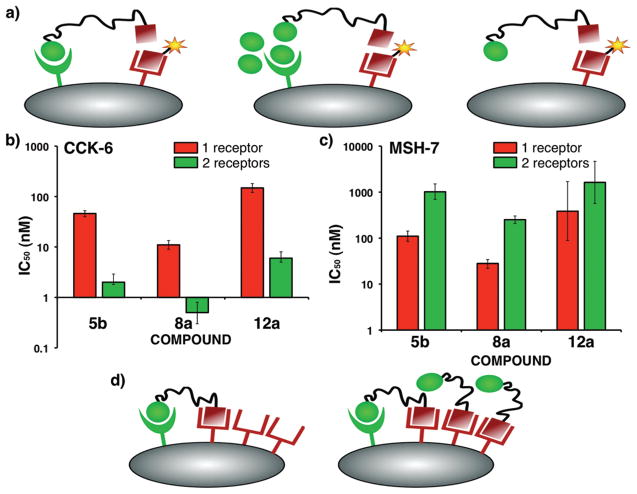
Figure 4.
Binding analysis of htBVLs. (A) The ligands are tested for bivalent binding on cells expressing both complementary receptors (left), and for monovalent binding by either saturating (blocking) one of the receptors on dual-expressing cells (middle), or on cells expressing single complementary receptor (right). A cross-linking event would result in higher affinity for each ligand. (B) Plot of monovalent and bivalent IC50 of CCK(6) ligand for the htBVLs 5b, 8a, and 12a displaying up to 24-fold higher bivalent affinity. (C) Plot of monovalent and bivalent IC50 values of MSH(7) ligand for the same htBVLs revealing decrease in bivalent affinity. (D) The lack of enhancement at the more abundant receptor could be explained on the basis that (left) at low concentrations, all the high affinity cross-linked sites are occupied corresponding to the less abundant receptor; (right) any subsequent binding event for the more abundant receptor is, therefore, monovalent resulting in no significant binding enhancement.

