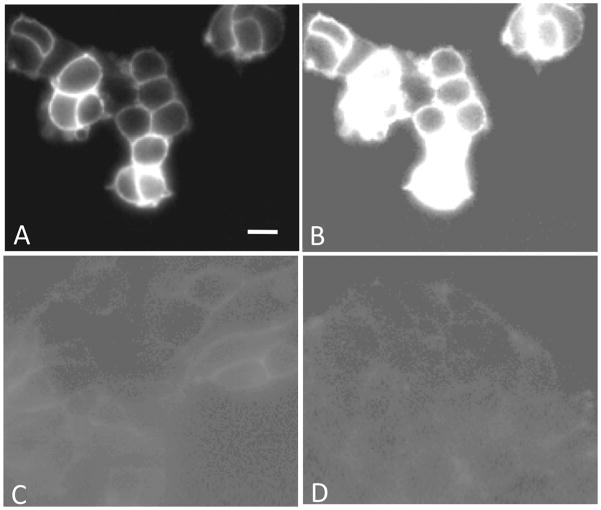
Figure 5.
Cell-surface labeling with the Cy5 conjugated htBVL 15. (A,B) Binding of Cy5-labeled htBVL 15 (0.2 nM) to cells expressing both hMC4R and CCK-2R. (C) Binding of 15 (0.2 nM) to cells expressing CCK-2R only. (D) Binding of 15 (0.8 nM) to cells expressing hMC4R only. Image (B) is the same as (A) with contrast and background set to levels shown in (C) and (D) to highlight and compare absolute levels of binding between dual receptor-expressing cells and monoreceptor expressing cells. The intensity differential underscores the utility of targeting receptor combinations to enhance specificity of binding of the imaging/therapeutic agent to tumor cells. Scale bar = 25 μM.

