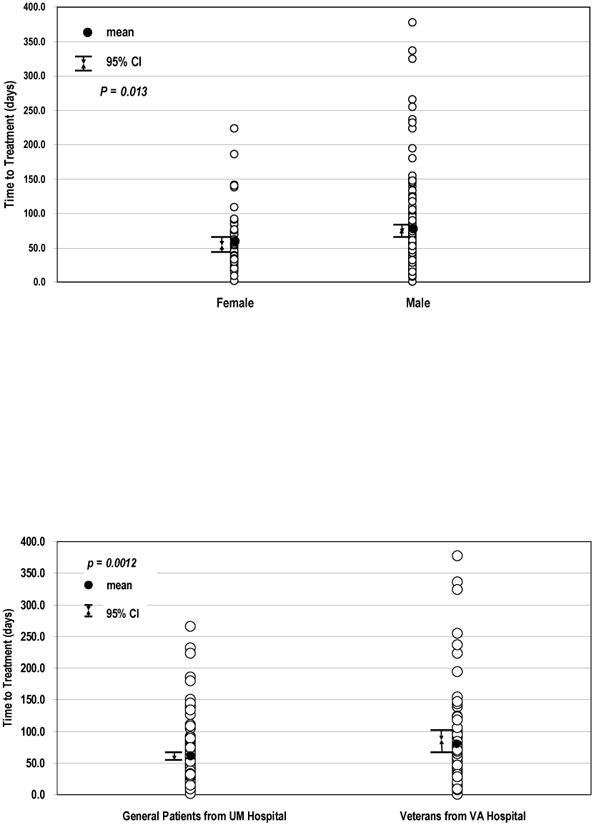
Figure 3.

Factors associated with time to treatment. Figure 3A: Time to treatment by gender with greater median time to treatment in men than in women (Log-rank, p = 0.013). Figure 3B: Time to treatment by institution with greater median time to treatment in the VA cohort than in the UM hospital cohort (Log-rank, p = 0.001).
