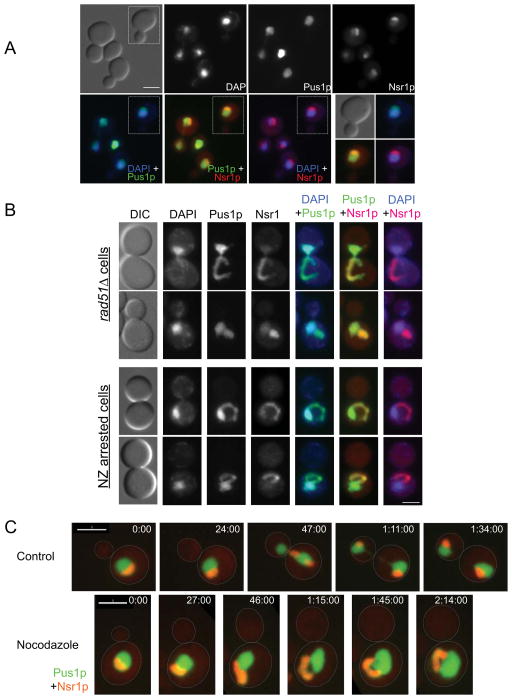
Figure 2. The mitotic nuclear extension coincides with the nucleolus.
(A) The nucleolus in wild type cells. Wild type cells (KW926) were fixed, stained with DAPI and imaged for Pus1p-GFP (green in the overlays), Nsr1p-mCherry (Nsr1p-CR, red in the overlays) and DAPI (blue in the overlays). The green/red overlap causes Nsr1p-CR to appear orange. Scale bar =3μm. (B) Nuclear morphology in rad51Δ cells (opt two rows) and wild type cells treated with nocodazole (NZ, bottom two rows). rad51Δ and nocodazole treated wild type cells (KW926) were fixed and imaged as described in (A). Shown are typical examples of cells with nuclear extensions. Note that the DNA in these cells is similar to the controls (panel A), while the nuclear extension (i.e. the part of the nucleus containing Pus1p-GFP but no DNA) coincides with the nucleolar marker Nsr1p-CR. Scale bar =3μm. (C) Wild type cells (KW926), either without (control) or with nocodazole treatment were imaged at the indicated time points. Pus1p-GFP is in green and Nsr1p-CR is in red (appears orange due to the overlay). For nocodazole treated cells, panels with only Pus1p-GFP or Nsr1p-CR are shown in Supplemental Figure S2B. Scale bar = 3 μm.

