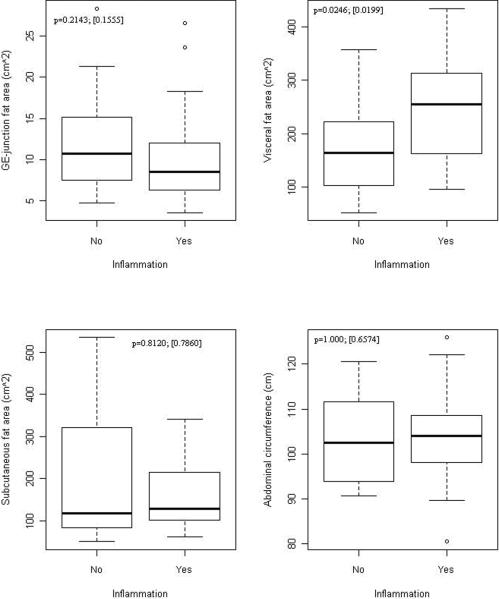
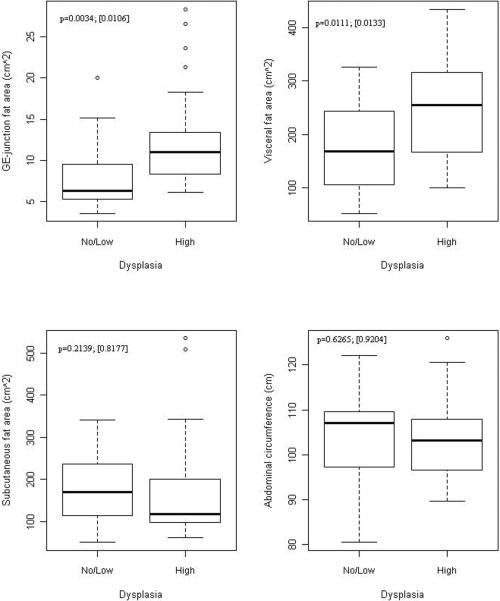
Figure 3. Association between fat depot surface area and esophageal inflammation and HGD in BE cases.
a: Association of fat distribution with presence of esophageal inflammation on histology in BE cases.
Association of fat distribution with grade of dysplasia on histology in BE cases.
Numbers on figures are p-values for unadjusted and adjusted association between fat measures and outcomes within cases. Unadjusted p-values are based on Wilcoxon Rank Sum test comparing continuous fat measures between groups defied by outcomes. Adjusted p-values in [] are based on logistic regression adjusting for BMI (continuous)
3b: Association of fat distribution with grade of dysplasia on histology in BE cases (with and without adjustment for BMI).
Numbers on figures are p-values for unadjusted and adjusted association between fat measures and outcomes within cases. Unadjusted p-values are based on Wilcoxon Rank Sum test comparing continuous fat measures between groups defied by outcomes. Adjusted p-values in [] are based on logistic regression adjusting for BMI (continuous)


