
Figure 3.
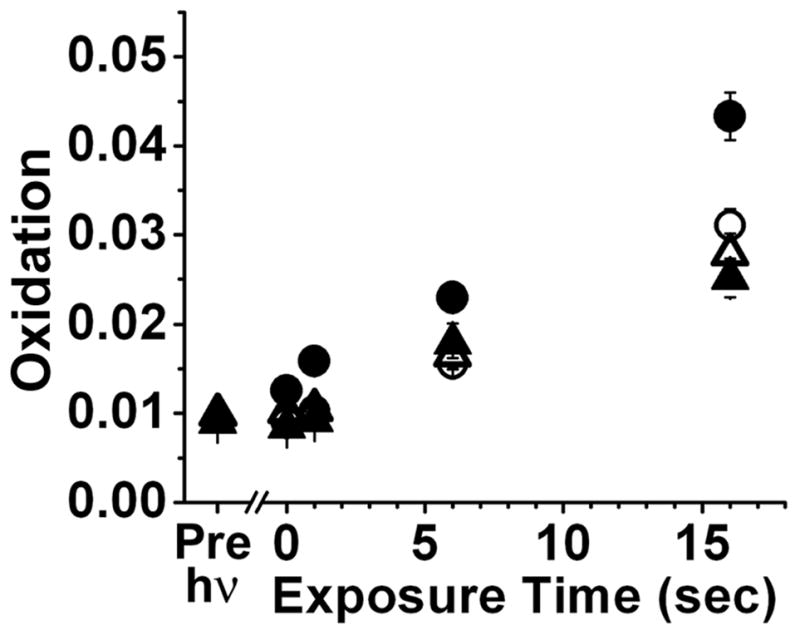
Increase of rod outer segment oxidation with increase in time of exposure to 360 nm light. Oxidation is measured as the “green”/“red” ratio of the fluorescence of the oxidized and intact forms of BODIPY C11. Rod outer segments of metabolically intact cells, exposed immediately (△, n = 15) and 60 min after rhodopsin bleaching (○, n = 20), and broken off rod outer segments, exposed immediately (▲, n = 12) and 60 min after rhodopsin bleaching (●, n = 21). The ratio reflecting the oxidation of BODIPY C11 in the cells before rhodopsin bleaching is shown as the Pre-hν point. Error bars represent standard errors.