Figure 4.
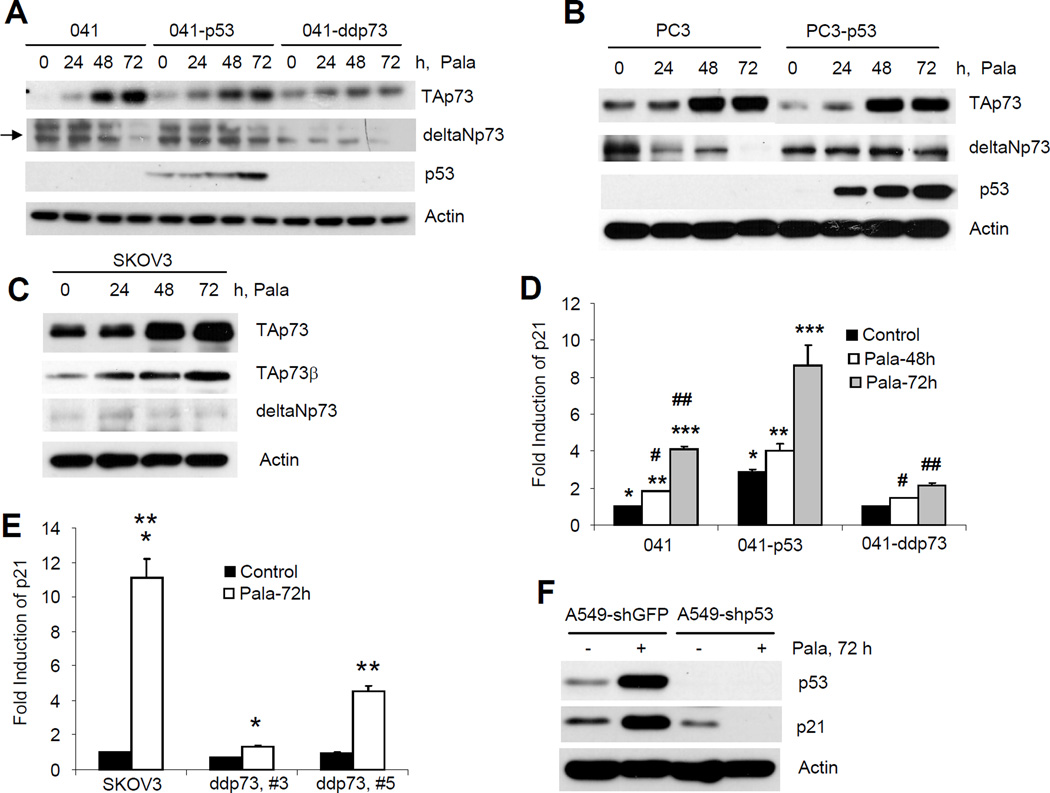
Activation of p53 and TAp73 by PALA treatment. (A) 041 and derivatives; (B) PC3 and PC3-p53 and (C) SKOV3 cells were treated with 250 µM/L of PALA for the indicated times and expression of TAp73, ΔNp73 and p53 were examined by Western blotting. Expression of TAp73β was also examined in SKOV3 cells (C). Representative data from three independent experiments are presented. (D) 041 and derivatives expressing p53 and dominant negative p73; and (E) SKOV3 and its derivatives expressing dominant negative p73 were treated with 250 µM/L PALA for the indicated times and expression levels of p21 mRNA were examined by real time PCR. The experiments were done in triplicate and average results with standard deviations as error bars are shown. p values <0.05 were considered statistically significant. For (D), p values for *, **, ***, #, and ## are 0.003, 0.0077, 0.02, 0.005 and 0.0001, respectively. For (E) p values for * and ** are 0.004 and 0.008, respectively. (F) A549-shGFP and A549-shp53 cells were treated with 250 µM/L of PALA for 72 h and expression of p53 and p21 were examined by Western blotting.

