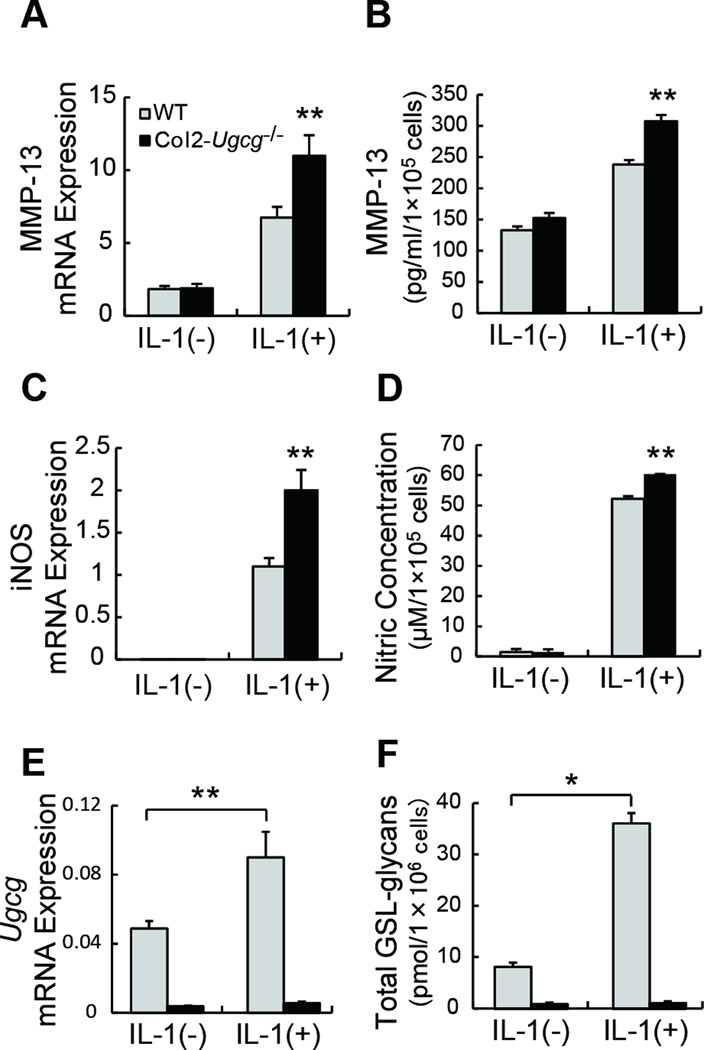
Figure 6.
Chondrocyte reaction induced by IL-1α stimulation. A, Expression of MMP-13 mRNA in cultured chondrocytes determined by real-time RT-PCR (n = 5 per group). B, Quantification of MMP-13 release in chondrocyte culture supernatant determined by ELISA (n = 5 per group). C, Expression of inducible nitric oxide synthase (iNOS) mRNA in cultured chondrocytes determined by real-time RT-PCR (n = 5 per group). D, Quantification of nitric oxide (NO) release in chondrocyte culture supernatant (n = 5 per group). E, Expression of Ugcg mRNA in cultured chondrocytes determined by real-time RT-PCR (n = 5 per group). F, Quantification of total GSL-glycans in cultured chondrocyte pellets. (n = 3 per group). Data shown are mean ± SEM. * = P < 0.01, ** = P < 0.05.

