
Figure 6.
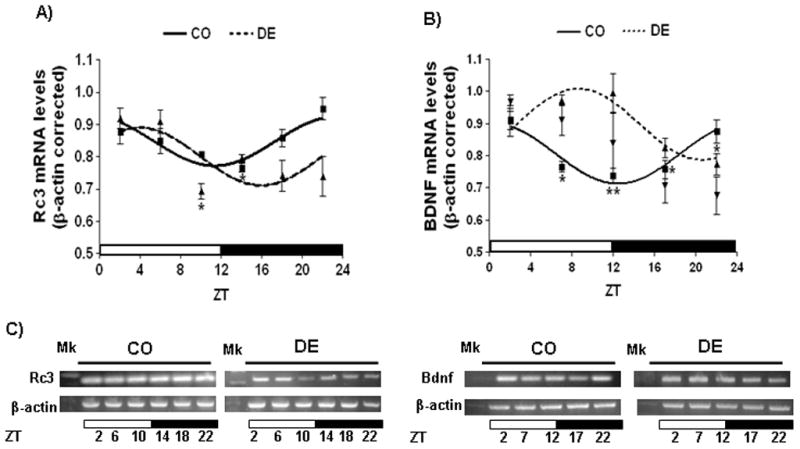
Daily RC3 and BDNF expression in the hippocampus of control and vitamin A-deficient rats. (A–B) Cosine fitting curves for normalized RC3 (A) and BDNF (B) mRNA levels throughout a day. Horizontal bars represent the distribution of light (open) and dark (closed) phases of a 24-h (ZT0-ZT24) photoperiod. Each point on the curves represents the mean ± SE of three pools of two hippocampus samples each at a given ZT (with ZT=0 when light is on). Significant daily variation was evaluated using one-way ANOVA followed by Tukey test with *P<0.05 and **P<0.01 when indicated means were compared to the corresponding maximal value in each group. (C) Representative patterns of PCR products at different ZTs throughout a day-night cycle.