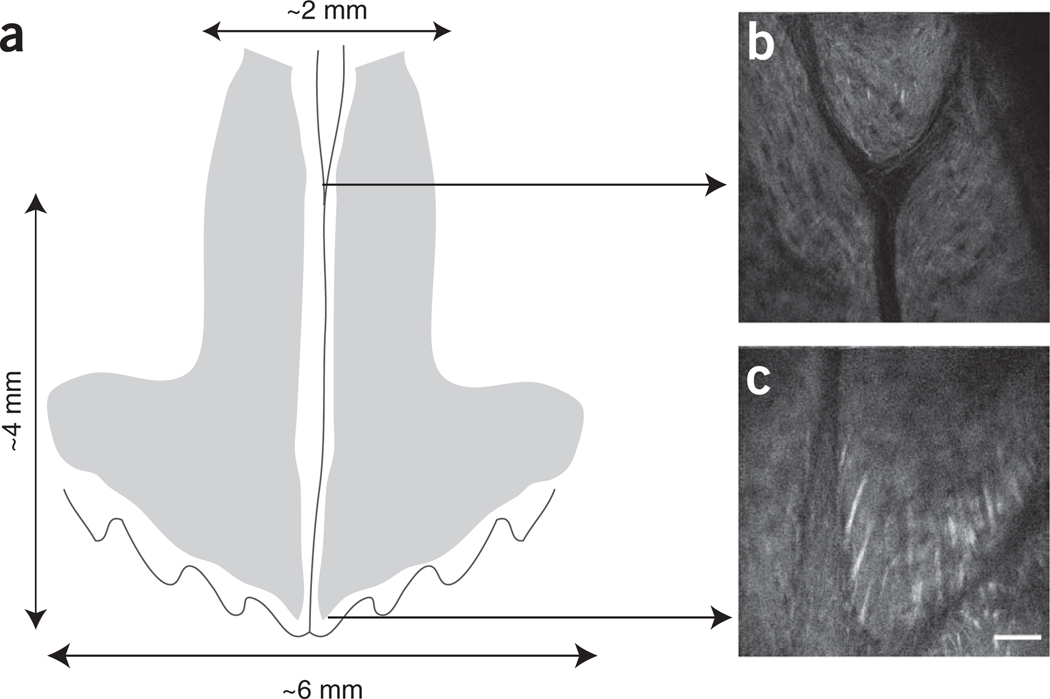
Figure 3.
Imaged area and specific spatial reference points. (a) Diagram representing reciprocal positioning of calvarium sutures (vertical line: sagittal suture; undulated line: coronal suture) and bone marrow cavities (gray areas). Note: the drawing is not to scale. The orientation of the head is as shown in Figure 2. (b,c) Examples of SHG signal from two reference points: (b) sagittal suture bifurcation and (c) intersection of sagittal and coronal sutures (right side). Scale bar, 50 µm (×30 objective mounted on our custom-made microscope).

