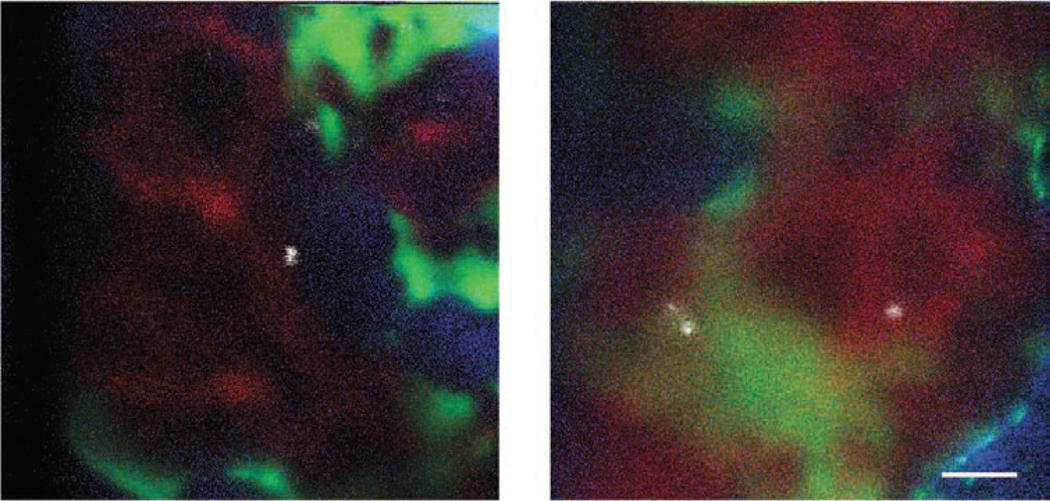
Figure 4.
Examples of bone marrow calvarium intravital microscopy images obtained with lasers and filters listed in Table 2. Two fields of view containing DiD-labeled cells (white: DiD signal), vasculature (red: quantum dot 800 signal), osteoblasts (green: EGFP signal) and bone collagen (blue: SHG signal) are presented. Note that the vasculature is more clearly demarcated in nonirradiated (left) than in irradiated (right) recipient mice. Scale bar, 50 µm.

