Figure 5.
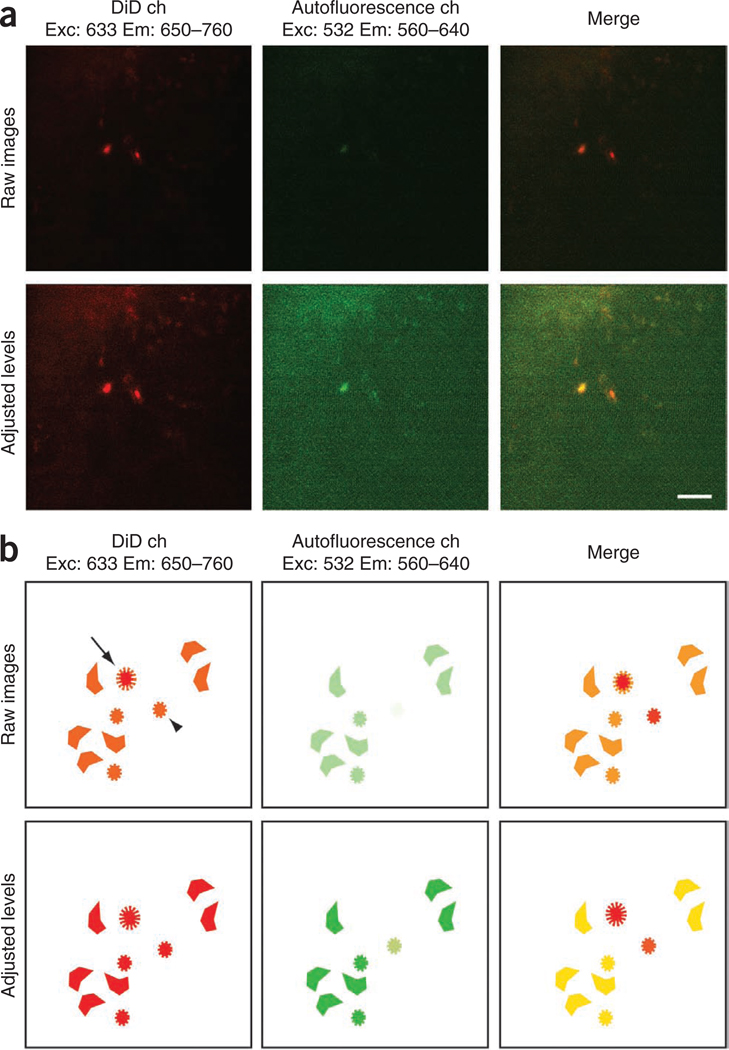
Validation of DiD signal through comparison with autofluorescence signal (measuring DiD:autofluorescence signal ratio). (a) Examples of raw and adjusted images containing a bright DiD-labeled (right) cell and a bright autofluorescent (left) cell. (b) Schematic diagram of bright and dim DiD-labeled cells (arrow and arrowhead), together with autofluorescent cells in the same field of view. Top row in both a and b, only minor color differences between DiD-labeled and autofluorescent cells are seen in the initial merged image (top right). Bottom row in both a and b, level adjustments highlight autofluorescent cells. Note that adjusting output levels increases the size of all cells, including the DiD-positive cells. In the adjusted, merged image (bottom right), autofluorescent cells have similar intensities in both channels, whereas the DiD-labeled cell present a more intense red color. Adjusted images can be used to measure the DiD/autofluorescence signal intensity ratio for autofluorescent cells and for the cell of interest (1 versus 1.7 and above). ch, channel. Scale bar, 50 µm.

