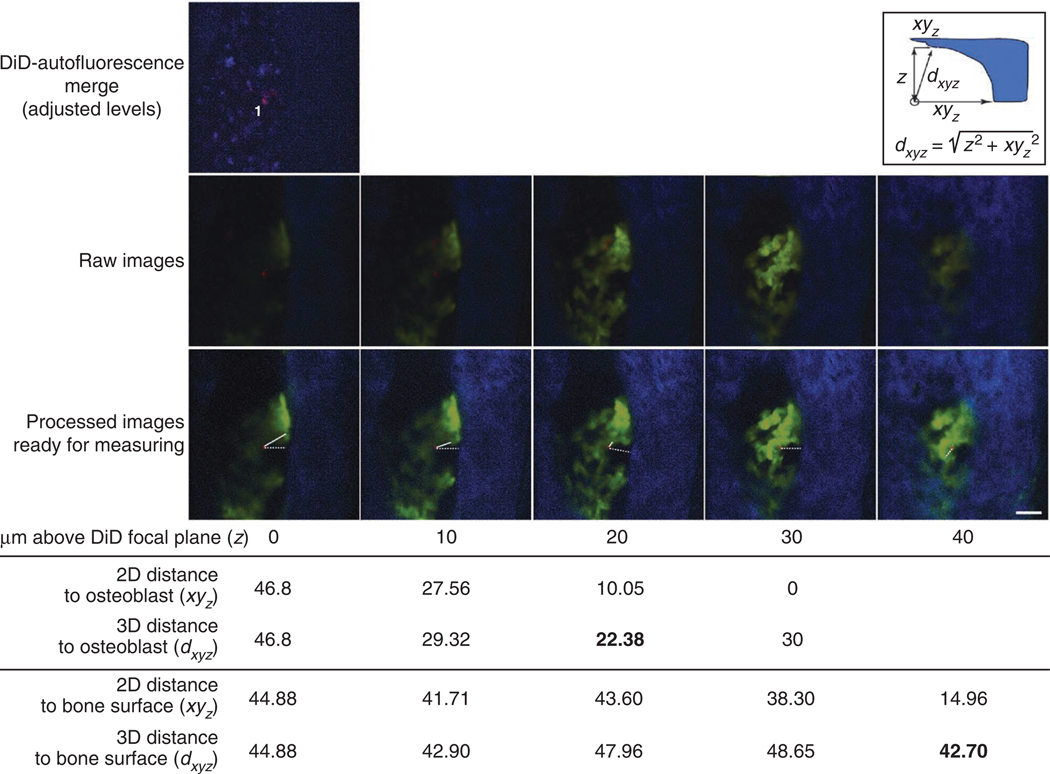
Figure 6.
Image analysis procedure. Top image: DiD-autofluorescence merge is checked to eliminate false-positive cells. In the presented case, one DiD-labeled cell is in focus (1). The red signal on the top right of the measured cell is from out-of-focus DiD cells located deeper and not presented in this example. Middle row: raw images of z-stacks containing DiD (red, indicating transplanted cells), EGFP (green, osteoblasts) and SHG (blue, bone cartilage) signals (step: 10 µm; each z-slice is acquired 10 µm above the previous one). Bottom row: Left, osteoblast (green), bone (blue) and DiD (red) signals are shown after optimization and signal enhancement. The same image of the DiD-labeled cell is then superimposed to the images of bone and osteoblasts closer to the top bone surface. Lines are drawn and measured from the edge of the DiD-labeled cell to the closest osteoblast (continuous lines) and bone surface (dashed lines) in focus. Insert: Pythagoras’ theorem is used to calculate the 3D distance from the DiD-labeled cell to the bone and osteoblasts. The DiD-labeled cell is the white circle at the bottom left and the bone is presented here in blue. For clarity, only the formula to calculate the 3D distance to the bone surface is shown. Calculated 2D and 3D distances at each z position are shown in the table below the images. No measurement is calculated at z = 40 because xy30 = 0, and therefore dxy40 cannot be shorter than dxy30. The shortest 3D distances between the DiD-labeled cell and the closest osteoblasts (22.38 µm) and bone surface (42.70 µm) are highlighted in bold. Scale bar, 50 µm.

