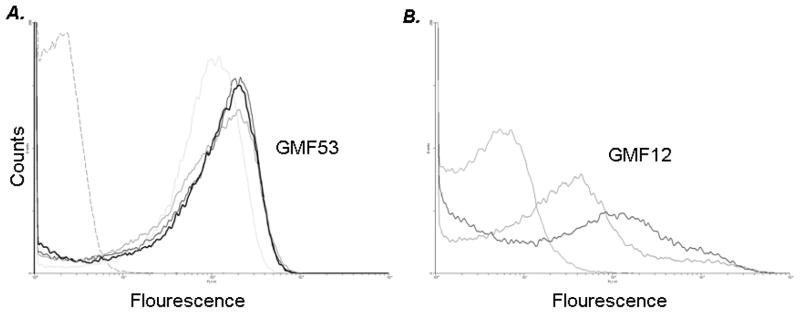
Figure 1. Mean Geometric Complement binding to 6C and 19A strains.
C3 binding to serotype 6C (n=4), 19A(n=2) isolates. A. Bacteria were incubated with 8% human complement (HC). C3 binding to the four 6C strain is illustrated in A. The isotype control (no human complement in the reaction mixture) is illustrated by broken grey line on the left of histogram. B. Bacteria were incubated with 8% human complement (HC). C3 binding to the two 19A strains is illustrated in B. The isotype control (no human complement in the reaction mixture) is illustrated by solid grey line on the left of histogram. Data shown is representative of two separate and comparable experiments. The x-axis represents fluorescence on a log10 scale and the y-axis the number of events (counts). Geometric mean fluorescence (GMF) for the 4 6C strains and 2 19A is included.

