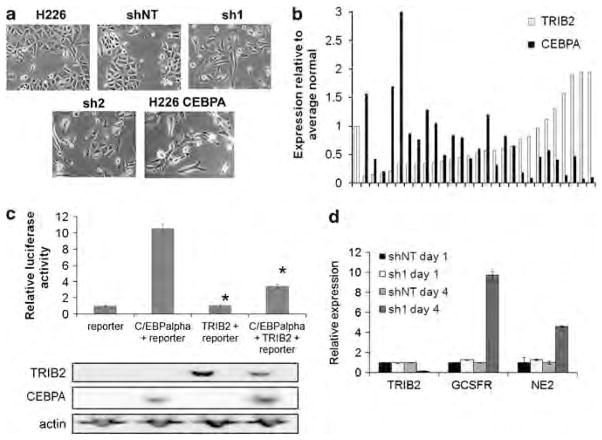
Figure 4.
TRIB2 inhibits C/EBPα function. (a) Phase-contrast images of H226 cells infected with shNT, sh1, sh2 or overexpressing C/EBPα. (b) Expression levels of TRIB2 and C/EBPα in the Origene lung cancer panel as measured using qRT-PCR. Values are normalized to actin and expressed relative to the average of the normal samples. Pearson correlation coefficient −0.38, P<0.05. (c) 293T cells were cotransfected with the indicated constructs as well as a reporter vector carrying a 4 × C/EBPα-binding site. Top panel: luciferase activity of the transfected cells. Activity was measured at 24 h after transfection. Shown is a representative experiment (n=6). Error bars are standard error of the mean. *, P<0.05, relative to reporter + CEBPA. Lower panel: western blot of TRIB2 and C/EBPα levels at 24 h after transfection with the indicated constructs. (d) Relative mRNA expression of TRIB2 and C/EBPα target genes normalized to actin. U937 cells were infected with sh1or shNT on day 0. The next day, a subset of cells was collected (day 1 expression levels), and all-trans retinoic acid (ATRA, for granulocyte colony-stimulating factor receptor) or granulocyte colonystimulating factor (for neutrophil elastase) was added to the culture media. Cells surviving puromycin selection were collected on day 4. Error bars represent standard deviation.

