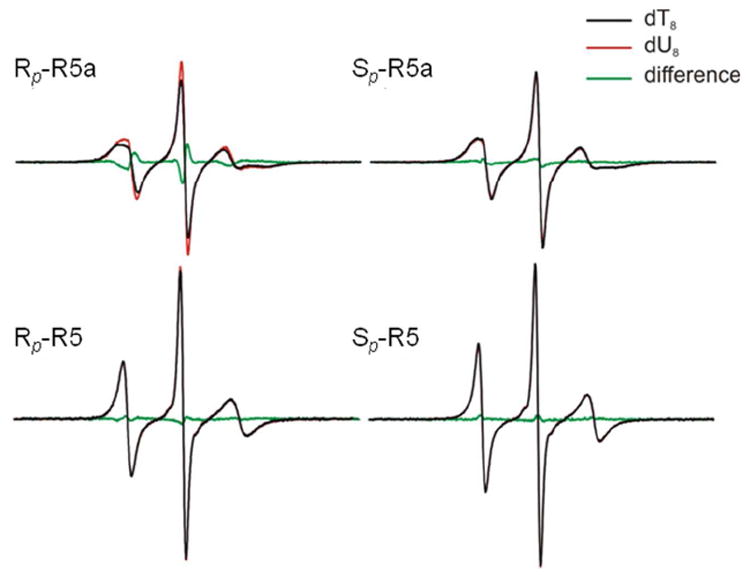
Figure 2.

EPR spectra obtained at 25°C. Black lines represent spectra obtained in the d(CTACTGpSC7T8TTAG).d(CTAAAGCAGTAG) duplexes (dT8), and red lines represent those in the d(CTACTGpSC7U8TTAG).d(CTAAAGCAGTAG) duplexes (dU8). Green lines represent the corresponding difference spectra.
