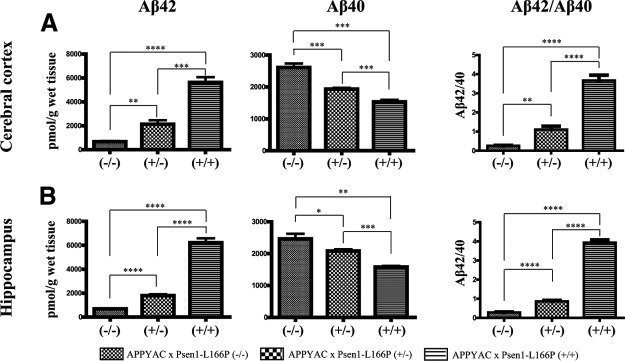
Figure 7.
Aβ levels in APP YAC × Psen1-L166P mice. Comparison of human Aβ40 and Aβ42 levels in cerebral cortices (A) and hippocampi (B) of mice expressing WT (−/−) or mutant Psen1. Aβ40 and Aβ42 levels were quantitated by ELISA in mice from the 3 genotypes (n=3–5 mice/group) at 6–8 mo of age. Values represent group means ± sd broken after the analysis was complete. Statistical analyses were performed with GraphPad Prism 5.04. Differences among means were assessed by 1-way ANOVA followed by Dunnett's or Tukey-Kramer post hoc test. *P < 0.05, **P < 0.01; ***P < 0.001; ****P < 0.0001.

