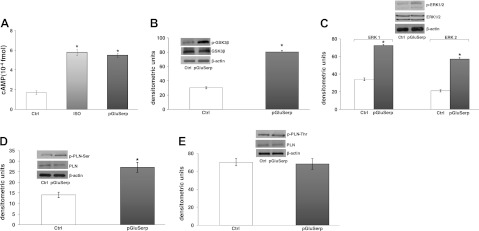
Figure 6.
A) cAMP concentrations in heart extracts. Percentage changes were evaluated as means ± se of 4 experiments. *P < 0.05, **P < 0.01 vs. control; §P < 0.05 between groups. B–E) Immunoblots showing phosphorylation of GSK3-β (B), ERK1/2 (C), p-PLN-Ser (D), and p-PLN-Thr (E) in cardiac ventricle (n=4/group).

