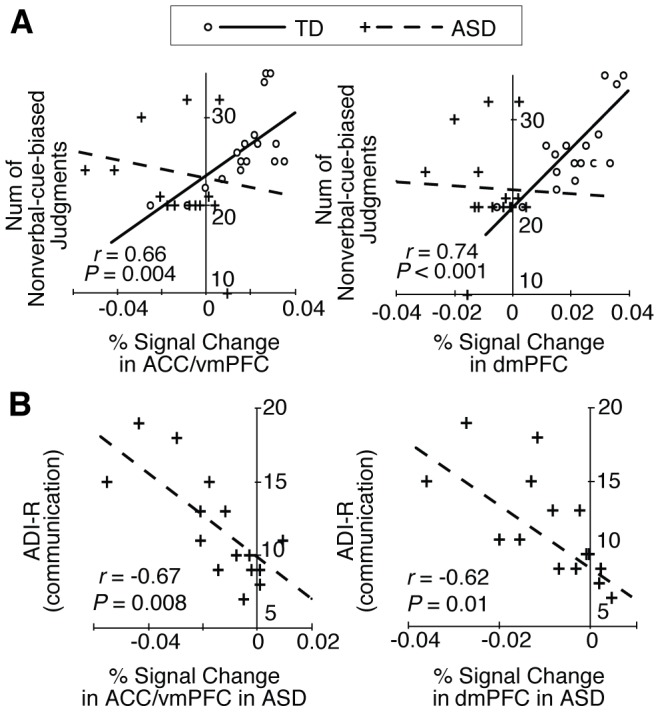
Figure 3. Comparison of fMRI signal and behavioral/clinical indices.

(A) Correlation between fMRI signals and the number of nonverbal-cue-biased judgments. In the TD group, among the four regions in shown Fig. 2B, only the activity in the ACC/vmPFC and dmPFC showed a significant positive correlation with the number of nonverbal-cue-biased judgments (P<0.05, Bonferroni-corrected). In the ASD group, there was no significant correlation between this behavioral metric and activity in either region. Circles and lines: data of TD participants; + and dashed lines: data of ASD participants. (B) Correlation between fMRI signal and clinical metrics. In ASD group, the fMRI signals in the ACC/vmPFC and dmPFC exhibited significant negative correlations with ADI-R communication sub-scores.
