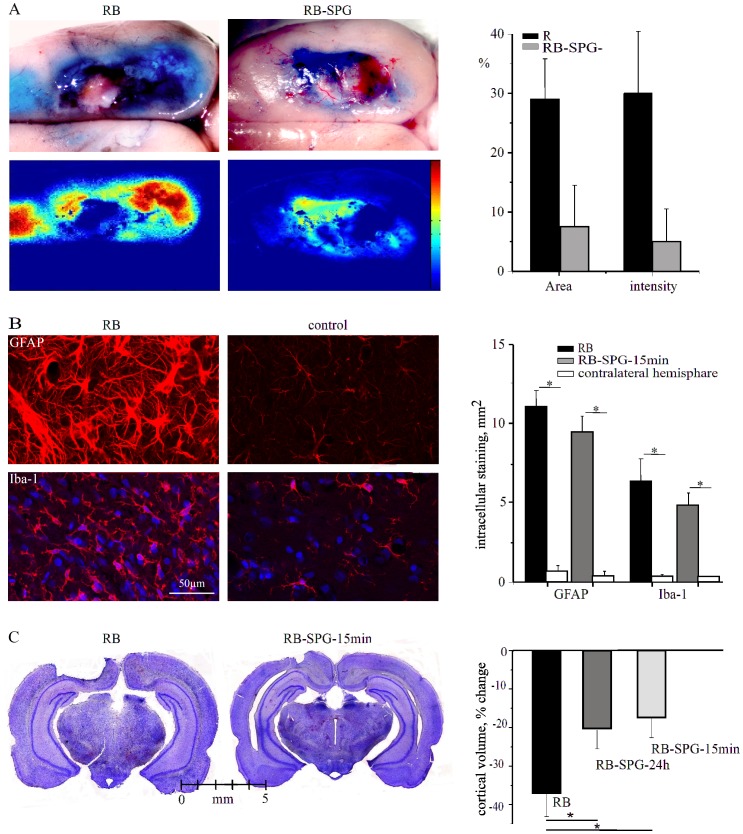
Figure 4. BBB breakdown, astroglial response and brain damage after SPG stimulation A, Two brain surface images after injection of Evans blue indicates BBB breakdown of RB-treated (left) and RB-SPG-15 min (right) rat brains.
Images below display EB (blue color) intensity, color coded. Both the size of the area with increased EB and the intensity were decreased in SPG-treated rats compared to non-stimulated animals (right graph). B, Immunostaining against the astrocytic marker, GFAP (upper panels) and the microglial marker, Iba-1 (lower panel) in RB-treated (left) and the contra-lateral control hemisphere (right). Bar graphs show area measured with intracellular staining (see Methods). C, Coronal sections of brains from RB (left) and RB-SPG-15 min (right) animals. Bar graphs show change in cortical volume after photothrombosis. *p<0.05.

