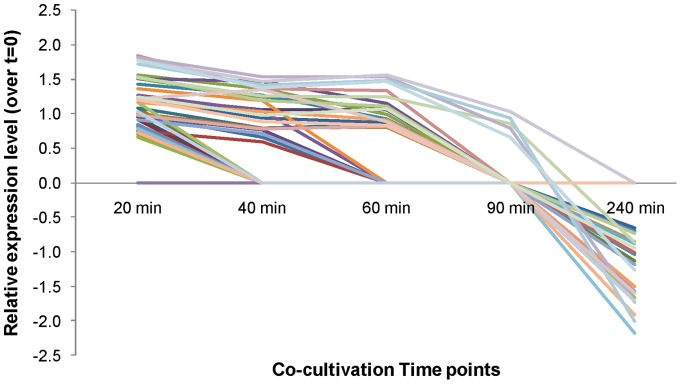
Figure 3. Schematic representation of the number of differentially regulated meningococcal genes.
Genes were identified in blood co-cultivation experiments at different time points, which are indicated by colour keys. Genes were classified into TIGR functional categories. Minus signs indicate down-regulated gene number.

