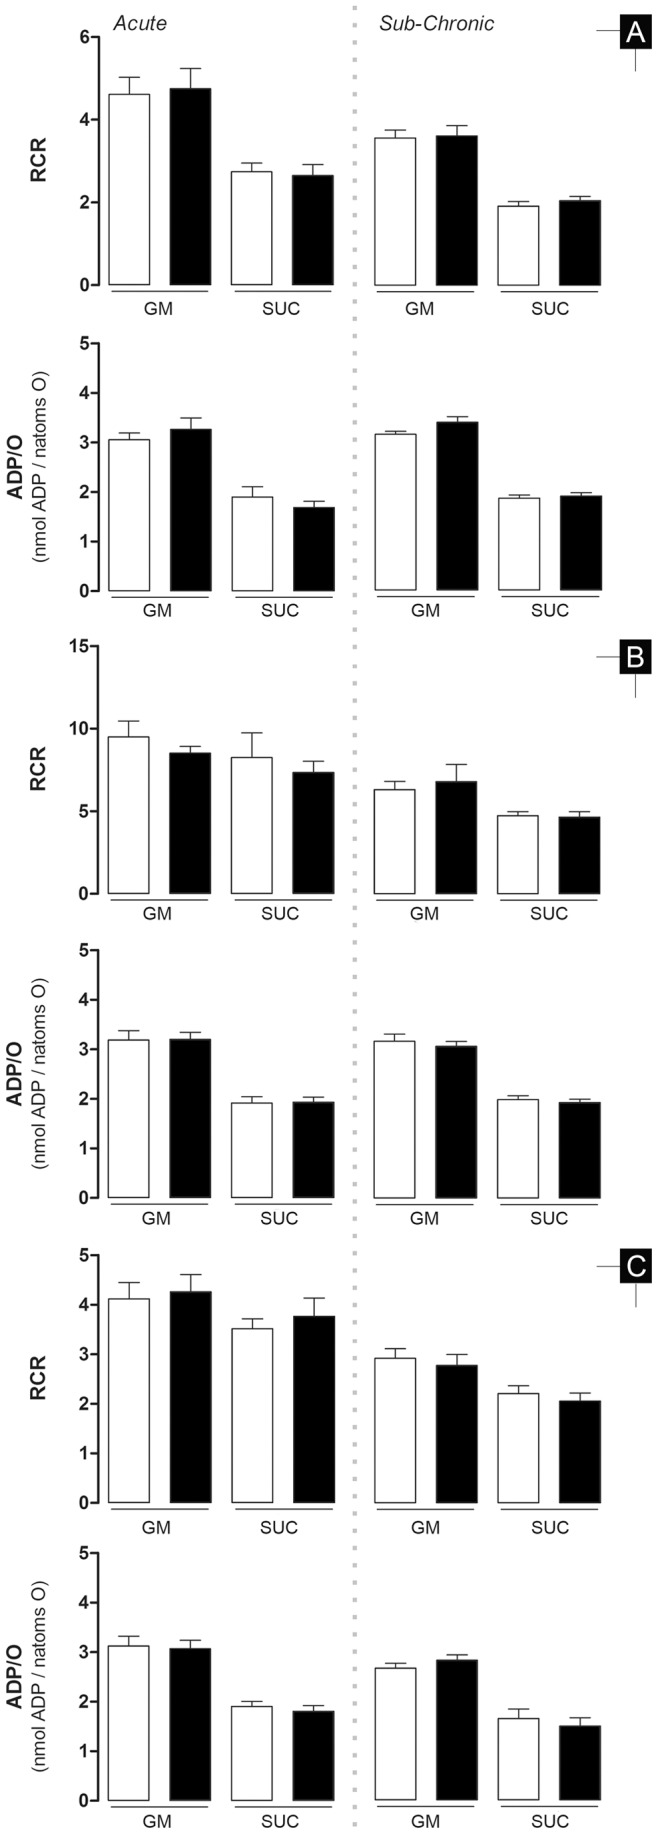
Figure 5. Respiratory Control Ratio (RCR) and ADP phosphorylated per consumed oxygen ratio (ADP/O).

A – heart; B – liver; C – kidney. Bars represent means of treatment groups (saline in white bars; DOX in black bars) with SE. Differences between treatment groups means within the same model were evaluated by matched pairs Student’s t test to exclude the variability related to mitochondrial isolation and electrode calibration but when assumptions were rejected the non-parametric Wilcoxon matched pairs test was applied (see Material and Methods for detailed information). *, p≤0.05 vs saline group of the same model. n = 10, 9 and 10 (acute model – heart, liver and kidney, respectively) or n = 12, 11 and 12 (sub-chronic model – heart, liver and kidney, respectively). GM - glutamate/malate; SUC - succinate.
