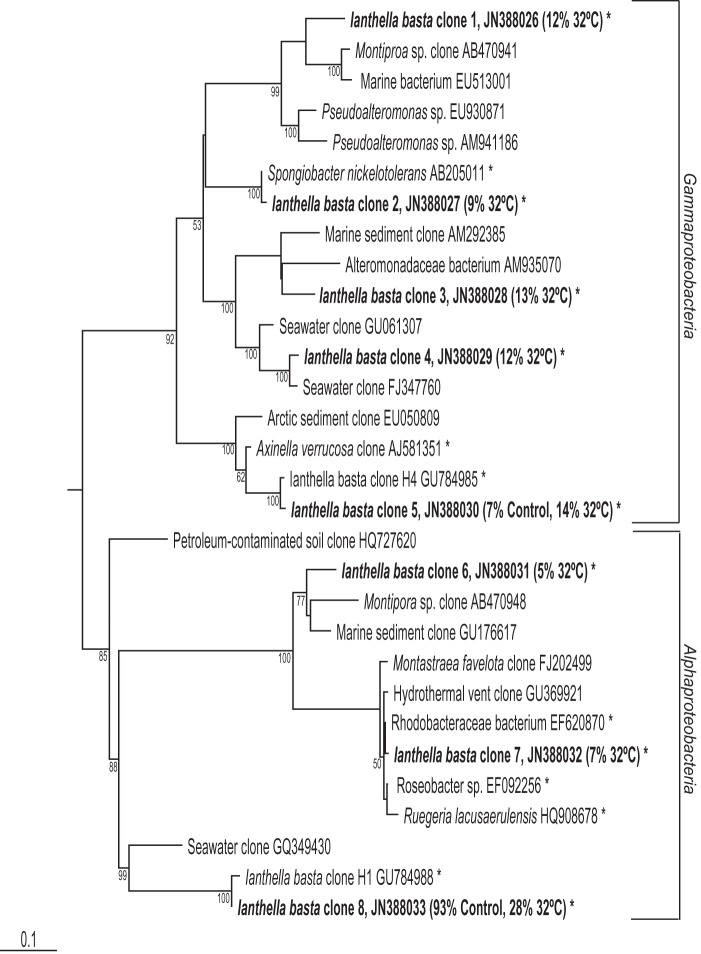
Figure 5. Maximum-likelihood phylogenetic tree from analysis of all 16S rRNA gene sequences retrieved from clone library analysis.
I. basta sequences from this study indicated by bold font, with the percentage of each library it comprised listed in parenthesis afterwards and * indicates clones isolated from marine sponges. The numbers at the nodes are percentages indicating the levels of bootstrap support based on analysis of 1000 re-sampled data sets. Only values >50% are shown. Scale bar represents 0.1 substitutions per nucleotide position.

