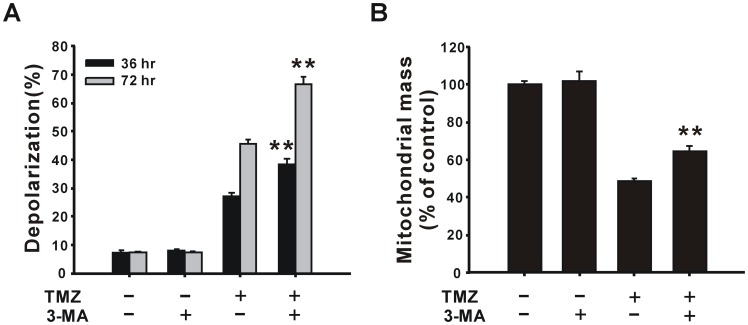
Figure 5. Effects of the autophagy inhibitor, 3-MA on the mitochondrial membrane potential and mitochondrial mass.
U87 MG cells were pre-treated with or without 2 mM 3-MA for 1 h followed by incubation with 400 µM TMZ for 36 h or 72 h. The mitochondrial membrane potential (A) and mitochondrial mass (B) were analyzed using flow cytometry with rhodamine 123 and NAO staining, respectively. Results are presented as the mean ± SD. **p<0.01 vs. each respective TMZ group.

