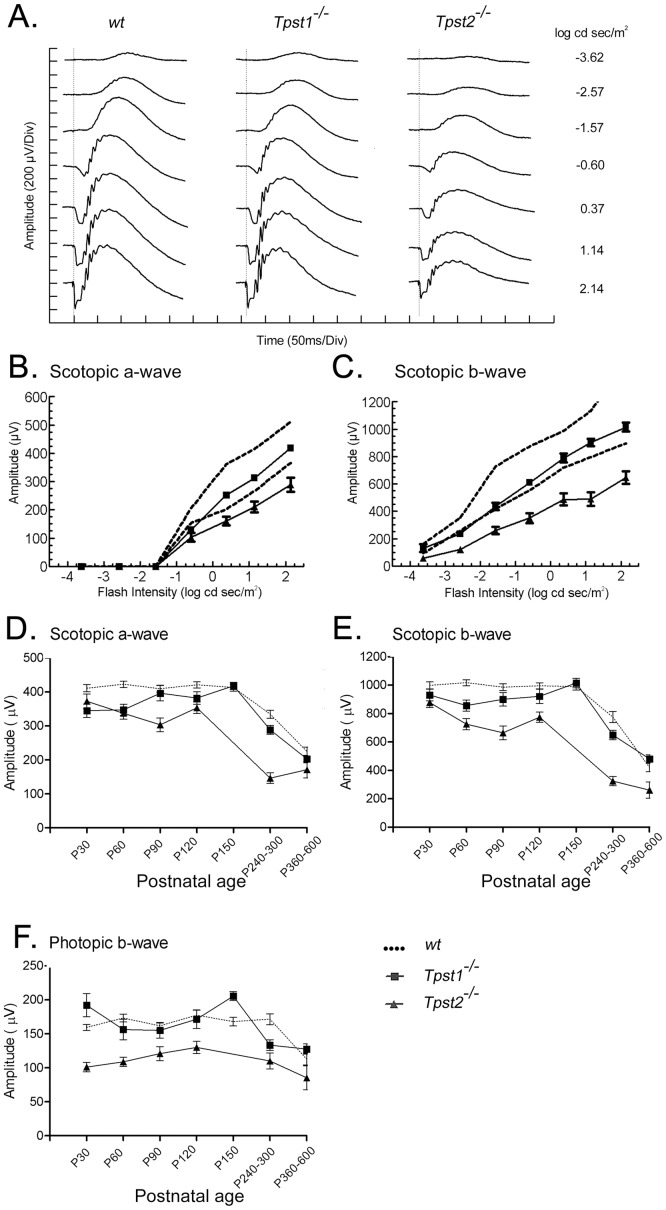
Figure 3. Electroretinographic responses from Tpst1−/− and Tpst2−/− retinas.
A. Representative waveforms recorded at different light intensities from wt, Tpst1−/− or Tpst2−/− retinas under scotopic conditions. B & C, in each panel, the dashed line represents the 95% confidence interval for responses obtained from 3 150-day-old wt littermate controls. The a- and b-waves obtained from 3 150-day-old Tpst1−/− mice (squares) fell near the lower limit of this interval at lower light intensities, but were well within the range at higher light intensities. In contrast, a- and b-waves recorded from 3 123-day-old Tpst2−/− mice (triangles) were reduced in amplitude and fell outside the 95% confidence interval at all light intensities tested. Development of the (D) scotopic a-wave, (E) scotopic b-wave, and (F) photopic b-wave responses for wt (dotted line), Tpst1−/− (squares), and Tpst2−/− (triangles) mice. Note that all responses from Tpst2−/− mice were lower than those for Tpst1−/− and wt mice at all ages. Error bars represent standard error of the mean. The differences between wt and Tpst2−/− presented in D are statistically significant between P30 and P300 (P<0.05–0.001) while the differences between wt and Tpst1−/− are only statistically significant at P30 and P60 (P<0.05–0.001). The differences between wt and Tpst2−/− presented in E are statistically significant between P60 and P600 (P<0.01–0.001) while the differences between wt and Tpst1−/− are only statistically significant at P60 (P<0.05). The differences between wt and Tpst2−/− presented in F are statistically significant for all time points tested (P<0.05–0.001) while the differences between wt and Tpst1−/− are statistically insignificant for all time points tested. Number of animals tested in D, E & F are presented in Table 3.

