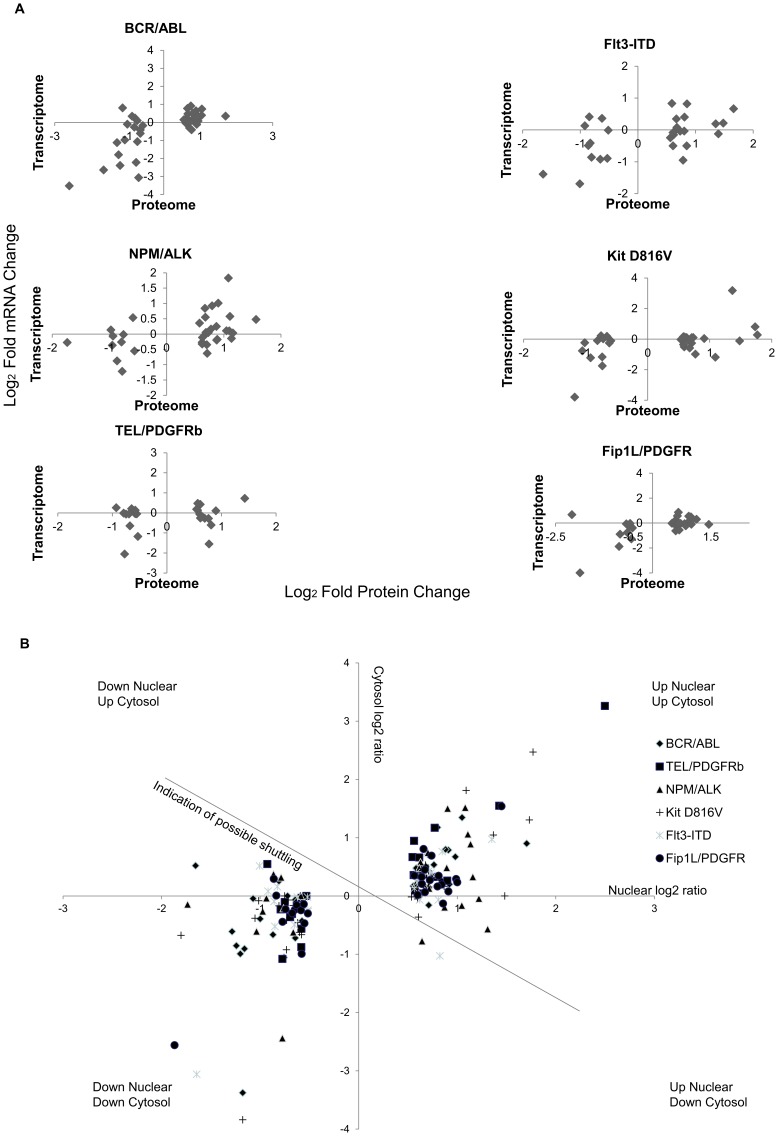
Figure 3. Correlation between protein/mRNA and nuclear/cytosolic protein ratios for proteins identified as changing.
Figure 3a; Correlation of mRNA expression changes and protein expression changes for nuclear proteins in response to 6 leukaemogenic PTKs expressed as log2 fold changes. Figure3b; The nuclear and cytosolic changes in protein expression levels (expressed as a ratio value compared to control Ba/F3 cells were plotted for the proteins in which a change of level was seen for four or more of the 6 leukaemogenic PTK transformed cells. Data are shown as Log2 ratios with control mock transfected Ba/F3 cells as denominator.

